GivingPulse
Q1 2024 Report
A holistic look at trends in giving behavior and perspectives in the U.S.
January to March 2024
Supported By:


Executive Summary
This report captures data and trends over the start of the new year for 2024. In addition to providing some deep dives on key segments of the population, we continue to build on our holistic analysis of who is donating time, treasure, talent, or influence, and what motivates them to get and remain involved.
We note the following takeaways for Q1 2024:
♥ Holding Steady: All forms of generosity held steady in Q1, including the percent of people giving monetary donations. Giving modes were similar to Q4 2023 +/- 2% as well. Possible dip: there was a short-term drop in all forms around the beginning of February that returned to previous levels afterwards. During this time, we saw an associated drop in the percentage of people who were solicited recently.
♥ Downwards National / Upwards International Shifts: The percentage of people supporting international organizations increased slightly in February before declining in March to levels seen at the beginning of the quarter. This increase corresponded with a relative drop in support for national organizations over the same time period.
♥ Donor Retention Among Volunteers: When donation rates dwindle overall, those who volunteer maintain their giving behaviors and are more likely to stay monetary donors. When monetary donation rates were at their lowest in Q1, volunteers made up over half of remaining donors.
♥ Predicting Solicitation Response: We predict that an additional 7% of respondents would have responded generously to solicitation if they had been asked recently. This group represents an untapped generosity market that is ready to give more if asked more frequently, and also highlights the need for increased engagement of the large number of unsolicited individuals who still may not respond generously if asked.
“GivingPulse continues to show that people are ready to give and to give more— and in a variety of ways. There are certainly concerning trends in giving right now, but there’s also a real opportunity to cultivate deep and meaningful relationships with communities of givers. We remain convinced that a generous mindset is in abundance and see so much potential for using this tool to build more resilience in the social sector.”

Part 1
Generosity-Related Behaviors

Each week, we ask 100 people across the USA what generous actions they undertook within the previous 7 days, for a combined sample of 1200 people each quarter. These actions could include giving money, time (volunteering), items, or advocating for causes or groups. We also ask people to distinguish whether they gave to a formal registered charity, an informal group, or an individual, and whether they contributed locally, nationally, or internationally.
Each of the major types of generosity are shown below on a 4-week rolling basis covering Q1 2024.

After the end-of-year generosity bump, it seems that "gave in any form" did not decline much in Q1. The low point (mid-February) trough appears in each of the last 3 years at this time. Note that all forms of giving dropped except volunteering, which seems to have been at a minimum in December and early January then gradually increased throughout February, before returning to its baseline rate (about 25% of respondents in any given week volunteered in the previous week).
Over the last 5 quarters, more people gave money and items than advocated and volunteered. Advocacy is always a little more prevalent than volunteering (which tends to be the least common) except at the end of the year (Dec-Jan) when people report doing both at equal rates.
Giving by Formality
Generous actions appear to rise and fall in parallel for the three groups we track: registered organizations, informal groups, and individuals. Registered organizations consistently receive the most support. This trend is consistent with previous weeks with registered organizations receiving 48-54% through last year.

We see some very small shifts in people’s giving behaviors. We also looked at how people fit into multiple giving modes. Compared to Q4 of 2023, there was a slight (2%) shift away from the number of people giving money, items, and time towards just giving money; money increased 2% and all 3 modes decreased 2%. Giving in all ways (money, items, time) dropped 2%. All other combinations in the form of a Venn diagram remained the same.
For recipient types, registered organizations (only) increased 1% and individuals (only) increased 1%, while support for all three types combined decreased by 3%. Respondents who supported both registered and unregistered groups also increased by 1% in Q1.


Looking more closely at respondents who gave to two recipient types, we find slight decreases of 2-3% across the board within the percentage of those who support two or more groups, compared to Q4 of 2023.
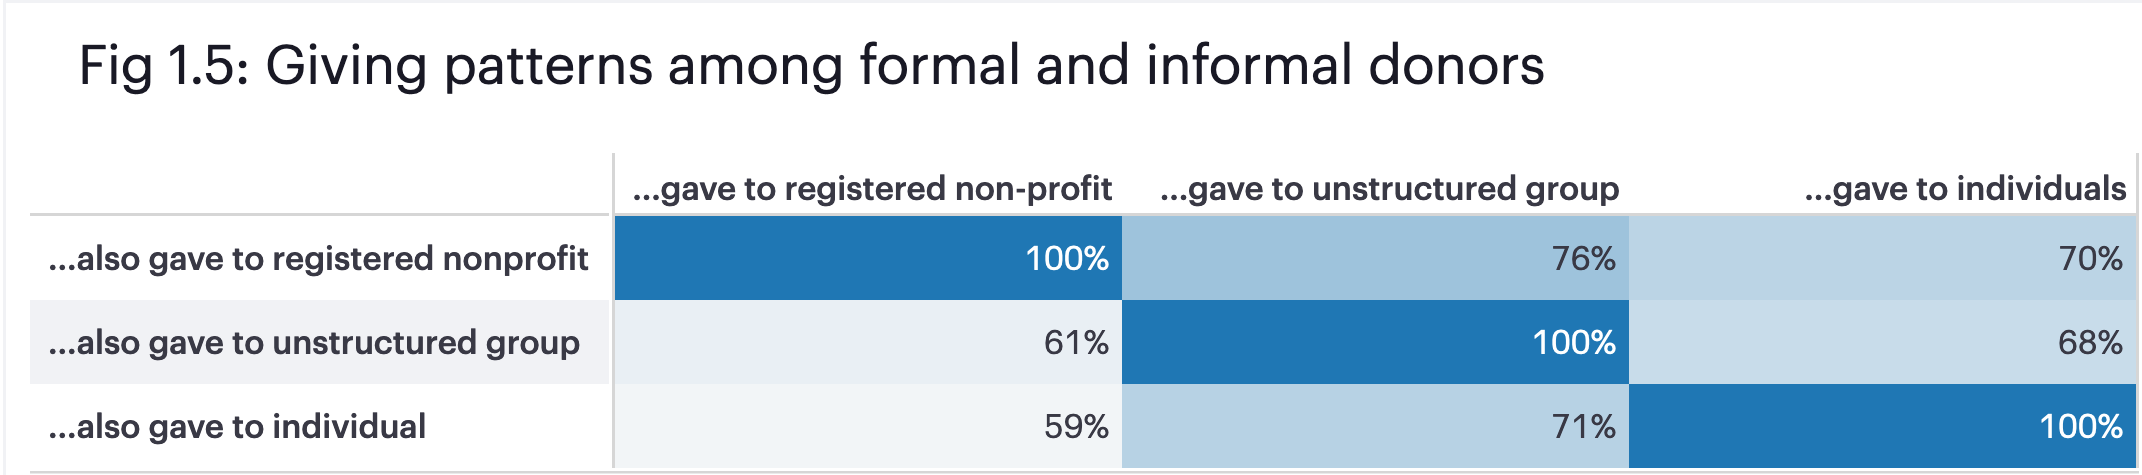
To understand how these modes intersect, we split formal monetary givers and informal monetary givers apart and then compared all other modes of giving that these groups reported. For example, 40% of people who only donated money in a formal way to a registered nonprofit organization also donated items to a registered nonprofit. The percentage who donated formally equals the percentage who donated through informal channels, so they showed no tendency to choose between formal only or informal only when it came to donating items. By contrast, informal monetary givers were twice as likely to also donate items through unregistered groups or to individuals directly (the informal channels). The same preference for informal channels persists in volunteering and advocacy work for informal givers, but there exists no preference one way or another for formal monetary givers.
We observed a similar trend in Q4 of 2023, so end-of-year seasonality (and the expected increase in solicitations) does not affect this.
We repeated this analysis for volunteers. In Fig 1.6b, "formal only" (dark blue) refers to people who volunteered recently with a registered nonprofit organization, "informal only" (light blue) to volunteers who worked with an informal group. Unlike the monetary donor comparison in Fig 1.6a, we see that formal volunteers prefer to donate other modes to informal channels, and informal volunteers prefer to contribute to informal channels.
We observed the same pattern in Q4 of 2023.


Giving by Locality

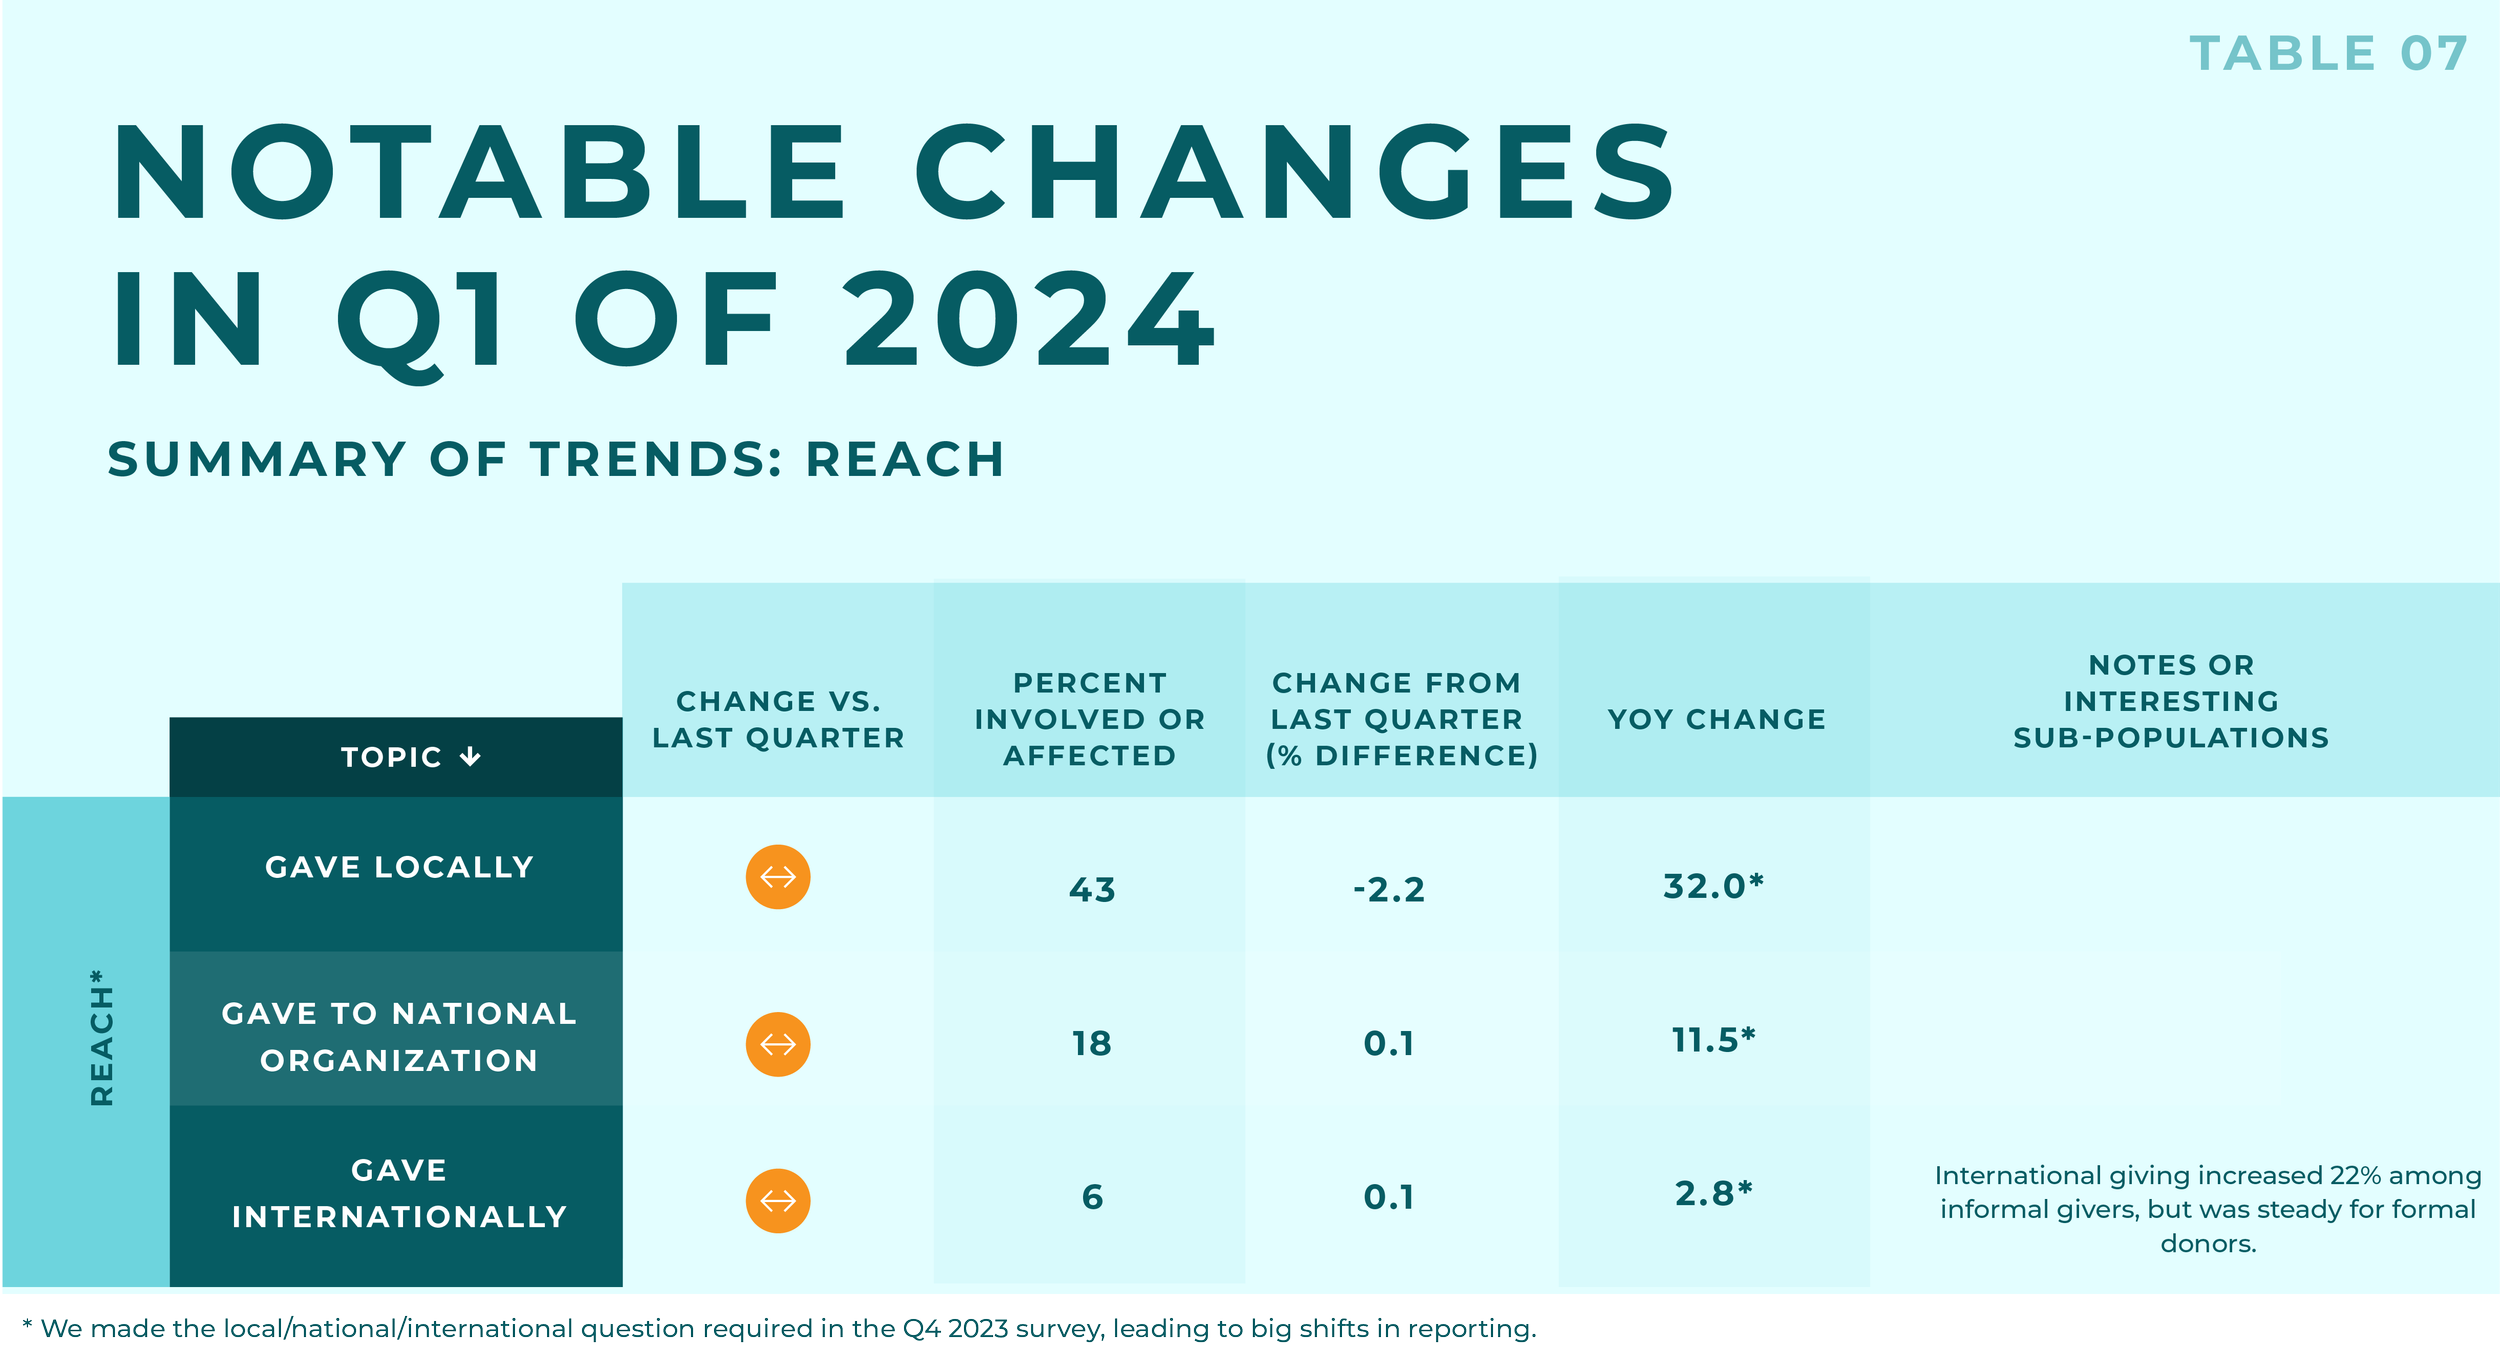
We ask people whether their most recent form of generosity was intended to help others in their own community, within the same country, or outside of their country. We found that the proportion of people targeting their generosity locally, nationally, or internationally is relatively stable, at 65%, 28%, and 9% respectively. Over the whole of 2023, these percentages typically varied by +/- 5%, except during the start of the Israel-Hamas war when international giving doubled from 8% to 17%.
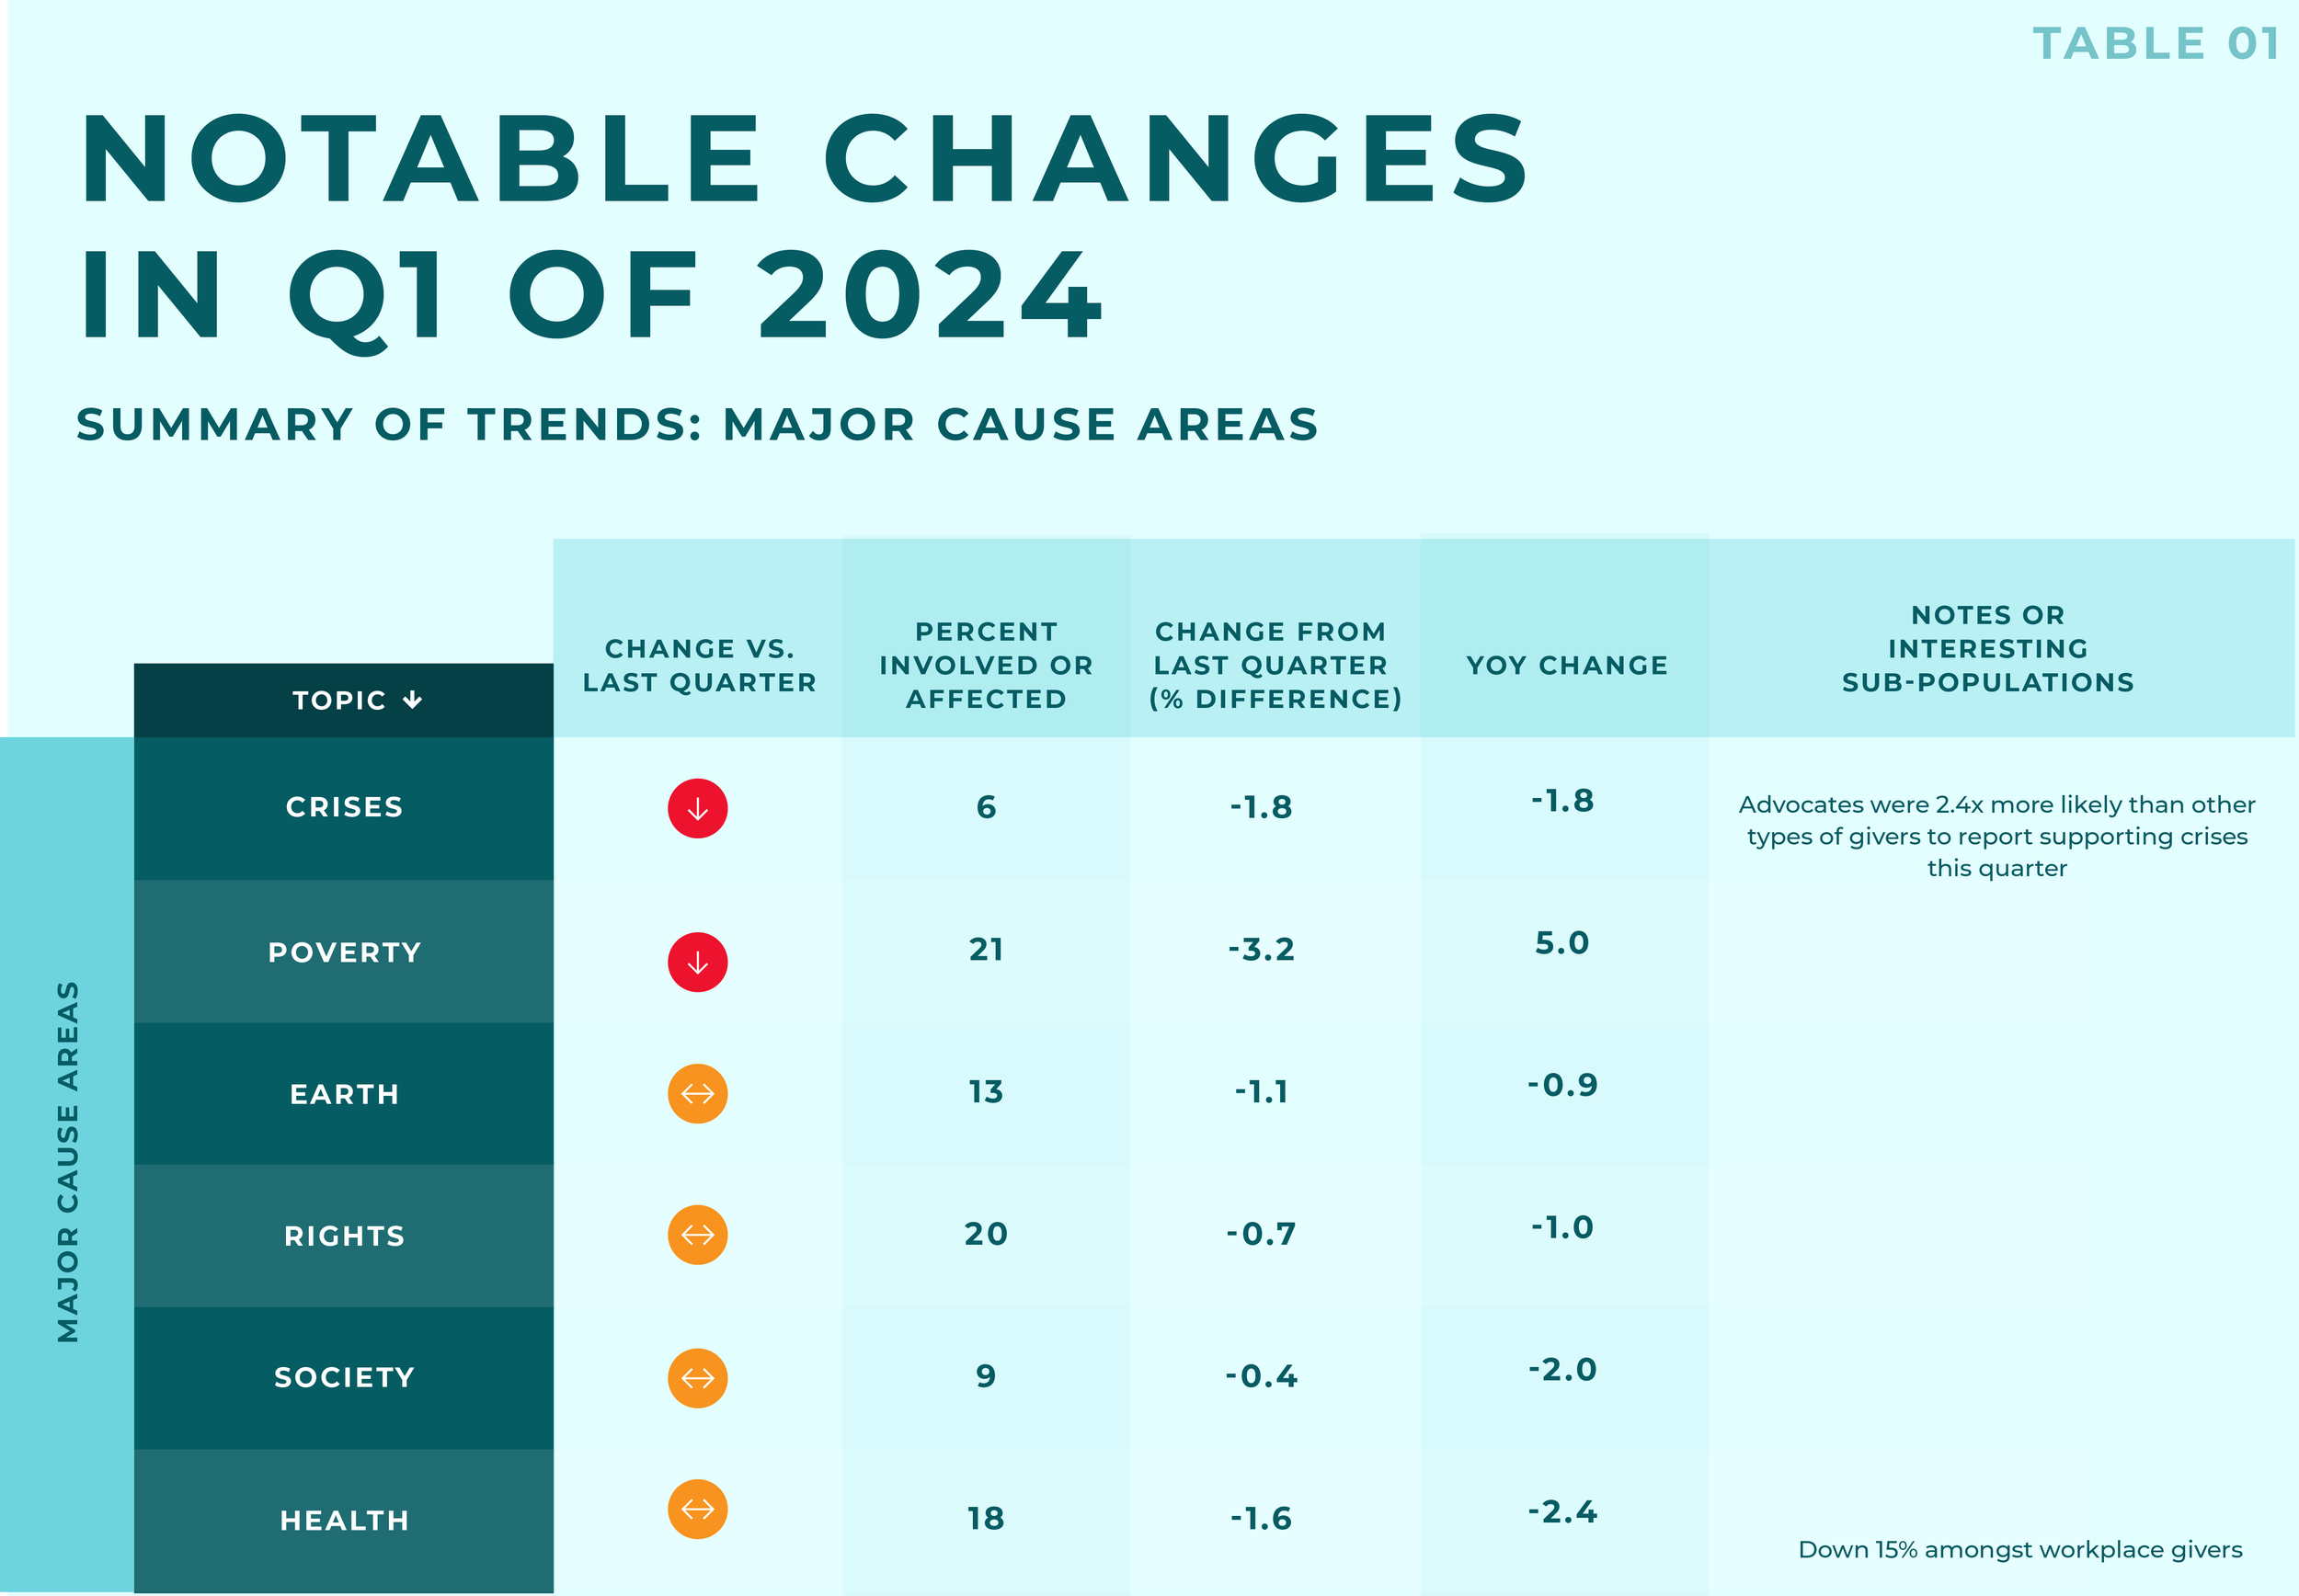
Support for national causes appeared to drop in February before rebounding to previous levels in March (from 28% to 20%, then back up to 30%) . There was a slight corresponding increase in support for international organizations over this time period. National support increased 8.9% from Q4 (see Table 1). Local causes remained stable at 65% +/- 3% over Q1.

Part 2
Generosity Trends at a Glance
Support for major cause areas appeared to be similar to Q4. Of these, support for crisis relief appeared to drop off the most, proportionally speaking, but only declined 1.8% in absolute terms. The average size of donation decreased by 10-12% for each of crisis relief, poverty, and rights-based cause areas in Q1. Earth/climate related donations remained flat. The size of donations to society-related causes increased 12.9% in Q1.
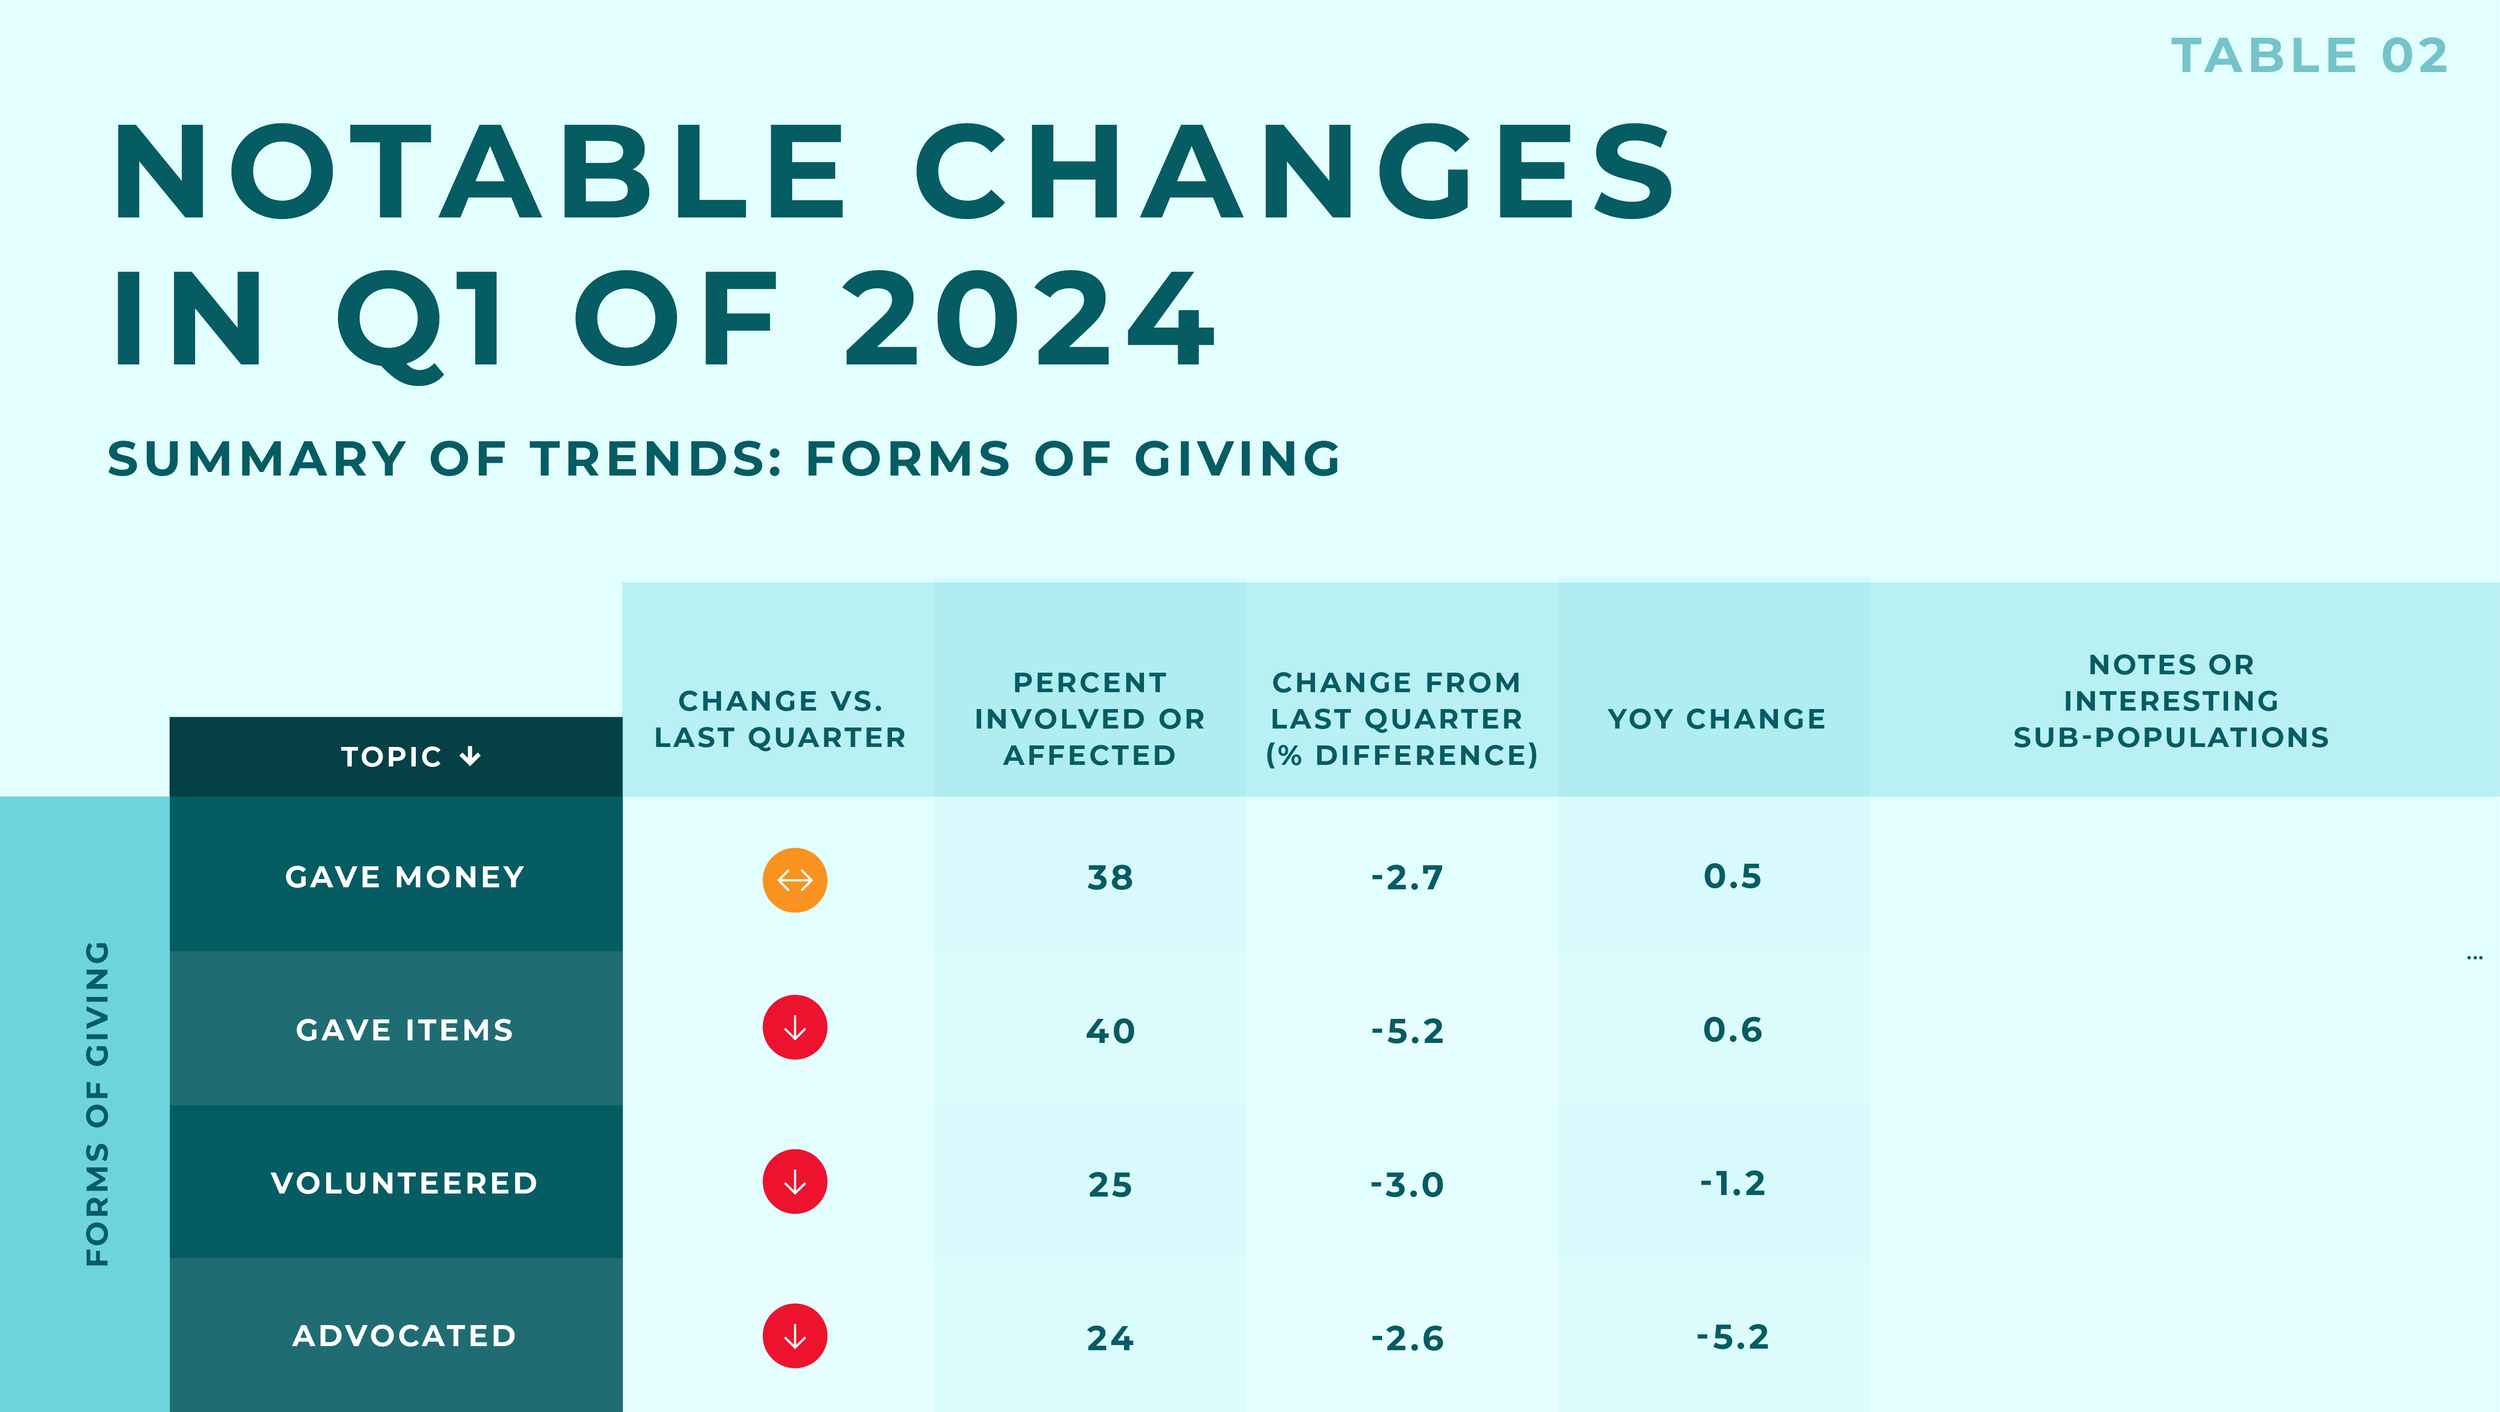
Support in the forms of giving money, time, and voice each dropped about 3 percentage points compared to Q4, and giving items dropped 5 percentage points.
We saw a 3 percentage point decrease in solicitation, and a corresponding drop in response to solicitation.

Pre-planned giving remained stable, while spontaneous giving dropped slightly (5%), indicating that more “planners” kept giving in the new year.

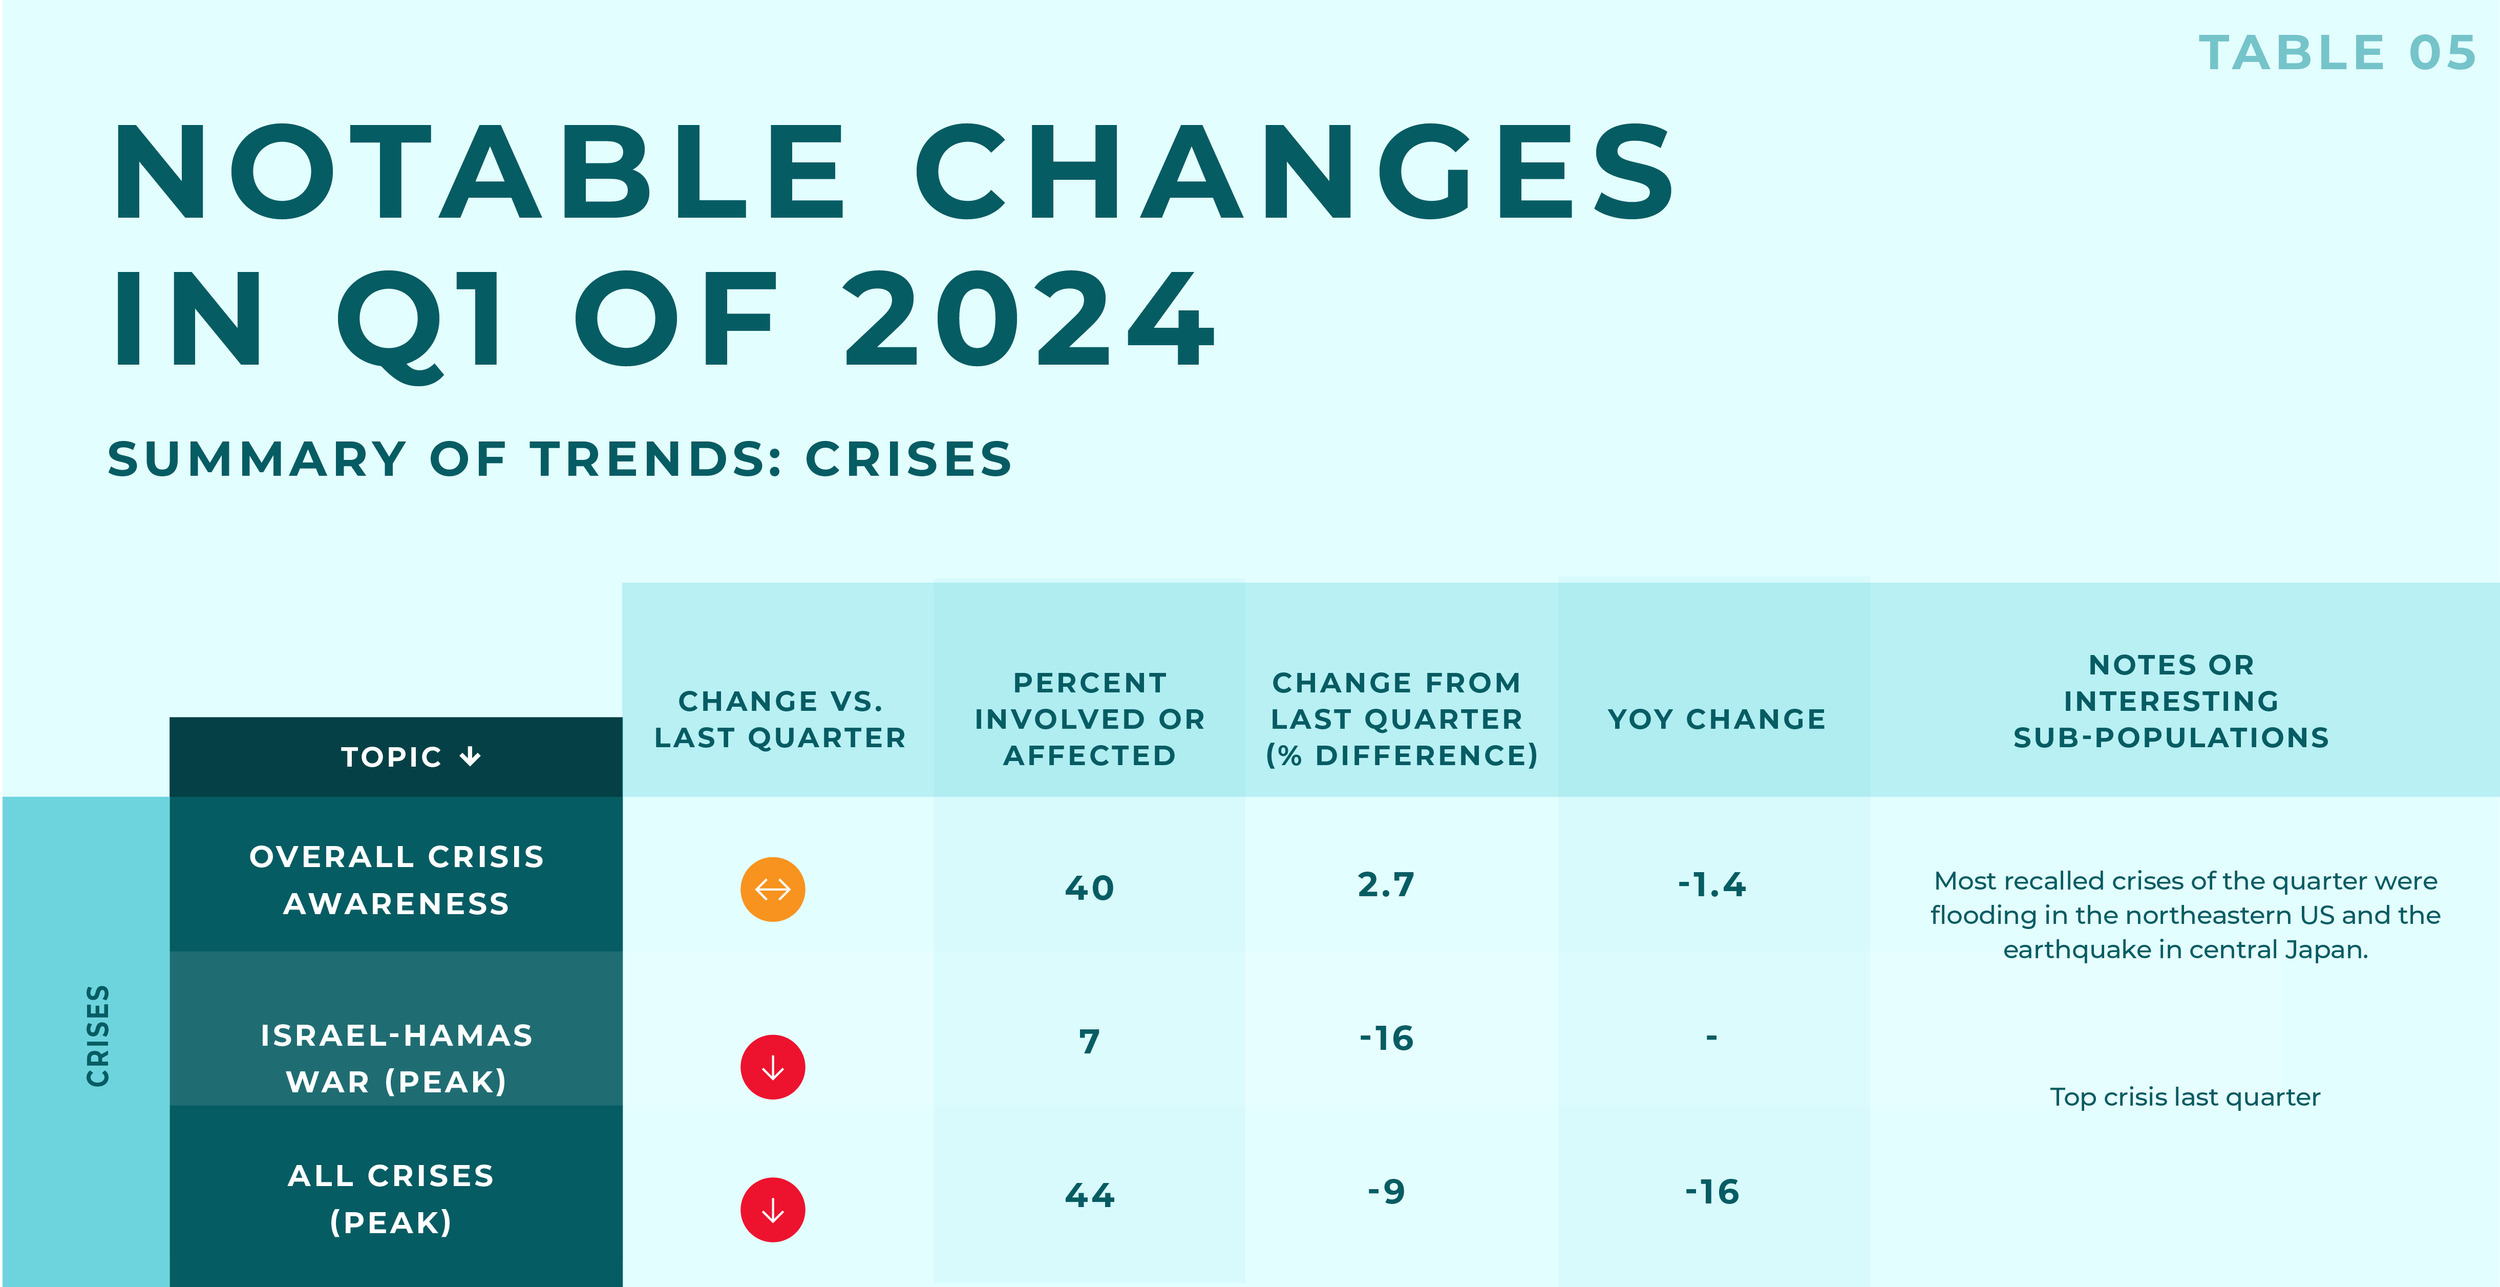
Overall crisis awareness remained flat. Mentions of the Israel-Hamas War were down from Q4, so that only a third as many people mentioned this conflict.
We saw some significant changes in how people donated in Q1. Of the common modes (online, in-person, person-to-person), in-person events decreased the most compared to Q4 and to Q1 2023.
About the same proportion of people gave to national and international organizations in Q1.
Part 3
Key Groups of Interest
Solicited vs. Unsolicited Respondents
We saw a downward trend in the percentage of people who were solicited in the month previous to completing the survey during Q1. About 53% reported being solicited in the beginning of January compared to 47% by the end of March. The nadir in solicitation was the second week of February, at 41%. Rates of solicitation were 2% higher in Q4 of 2023.

Looking at the population who gave recently, we were much more likely to find that they had been solicited recently than those who did not give – about half of respondents who gave in the previous week were solicited in the month prior to giving, highlighting the importance of frequent engagement to driving generosity . Fig 3.3 and Fig 3.4 mirror what we observed in Q4 of 2023 +/-1%, except that 5% more givers were solicited in the last 7 days of Q4.

The percent increase in givers who were recently solicited in Q1 was split equally among spontaneous givers and planners (Fig 3.4).
There was a 3-4% decline in the percentage of those who "see many reminders to give" in Q1 (Fig 3.5), compared to the same subgroups in Q4. No one mode was particularly affected more than the others.


For GivingPulse analyses, we generally consider an individual to have been solicited if the solicitation occurred within the previous week. However, for this specific analysis, unless otherwise indicated, we define “solicited” as an individual who has been solicited in the previous month, to increase the scope of potentially relevant behaviors. This definition encompasses people who reported being solicited in the previous week and those who were solicited between one and four weeks prior to data collection.

In mid-March we saw a week when non-religious people were both solicited and responded at a greater rate than religious people (about 5% higher). This only happened once in 2023 around Giving Tuesday and the period leading into the end of year giving season. This is surprising because this period coincided with a period in March of 2024 when people of multiple faiths were observing annual fasts simultaneously (Lent, Ramadan and Norouz).
Applying this model to unsolicited respondents, we predict that the response rate for those not solicited in the past week is approximately 9%, meaning that if everyone in the unsolicited group had instead been solicited in the past week, about 9% of this group exhibit traits that make them likely to have responded with generosity. Looking at the sample as a whole, this makes up about 7% of all respondents, which would theoretically be added to the 10% who actually responded to a solicitation in the past week. This model is relatively conservative when it comes to the predicted response rate. In selecting this model, we favored one with higher precision, meaning that it is less likely to falsely identify someone as a responder than a non-responder, and hence produces a lower response rate estimate.
This group represents an untapped generosity market that is ready to give if asked more frequently (or at all). The vast majority of people who were predicted to respond positively already gave something in the past week, but given that this generosity occurred unprompted, it is likely that it could be increased (in either volume or frequency) or channeled into specific causes with further engagement. Like the actual response rate the predicted response rate does not vary significantly by income or gender. Interestingly the predicted response rates also do not vary by age group, although this may partially be an effect of small within-group sample size.


Predicting Response to Solicitation
In Q1 2024, 28% of people reported being solicited in the previous week. Of those solicited, 37% responded to the solicitation with generosity. In addition to identifying the characteristics of people that had not been solicited recently (which we looked at in Q4 2023), it is important to consider the likelihood of previously unsolicited people to respond to solicitation, had they been solicited more recently.
[GivingPulse asks respondents when they have most recently been solicited — within the past week, past month, past year, or never/cannot recall — and for respondents who have been solicited within the past week, we ask how they responded.]

Interestingly, there were no significant variations to either weekly or monthly solicitation rates by religiosity or by region of residence in Q1, a departure from Q4 2023 trends. In 2023 overall, solicitation rates did differ significantly between religious and non-religious respondents but we observed this gap narrowing around the year-end giving season. This quarter, there continued to be minimal differences in solicitation rate, and the monthly solicitation rate among non-religious respondents even exceeded that of religious respondents in early March, a rare occurrence in the GivingPulse dataset (Figure 3.6a).
First, it is important to examine factors that relate to a person’s likelihood of responding, noting that the characteristics that make someone more or less likely to be solicited are not necessarily the same traits that make them more or less likely to respond.

Notably, income and financial strain appear to have limited influence over someone’s likelihood of responding to solicitation, as does religiosity at a quarterly level (see Figure 3.6b for a weekly breakdown of this trend).
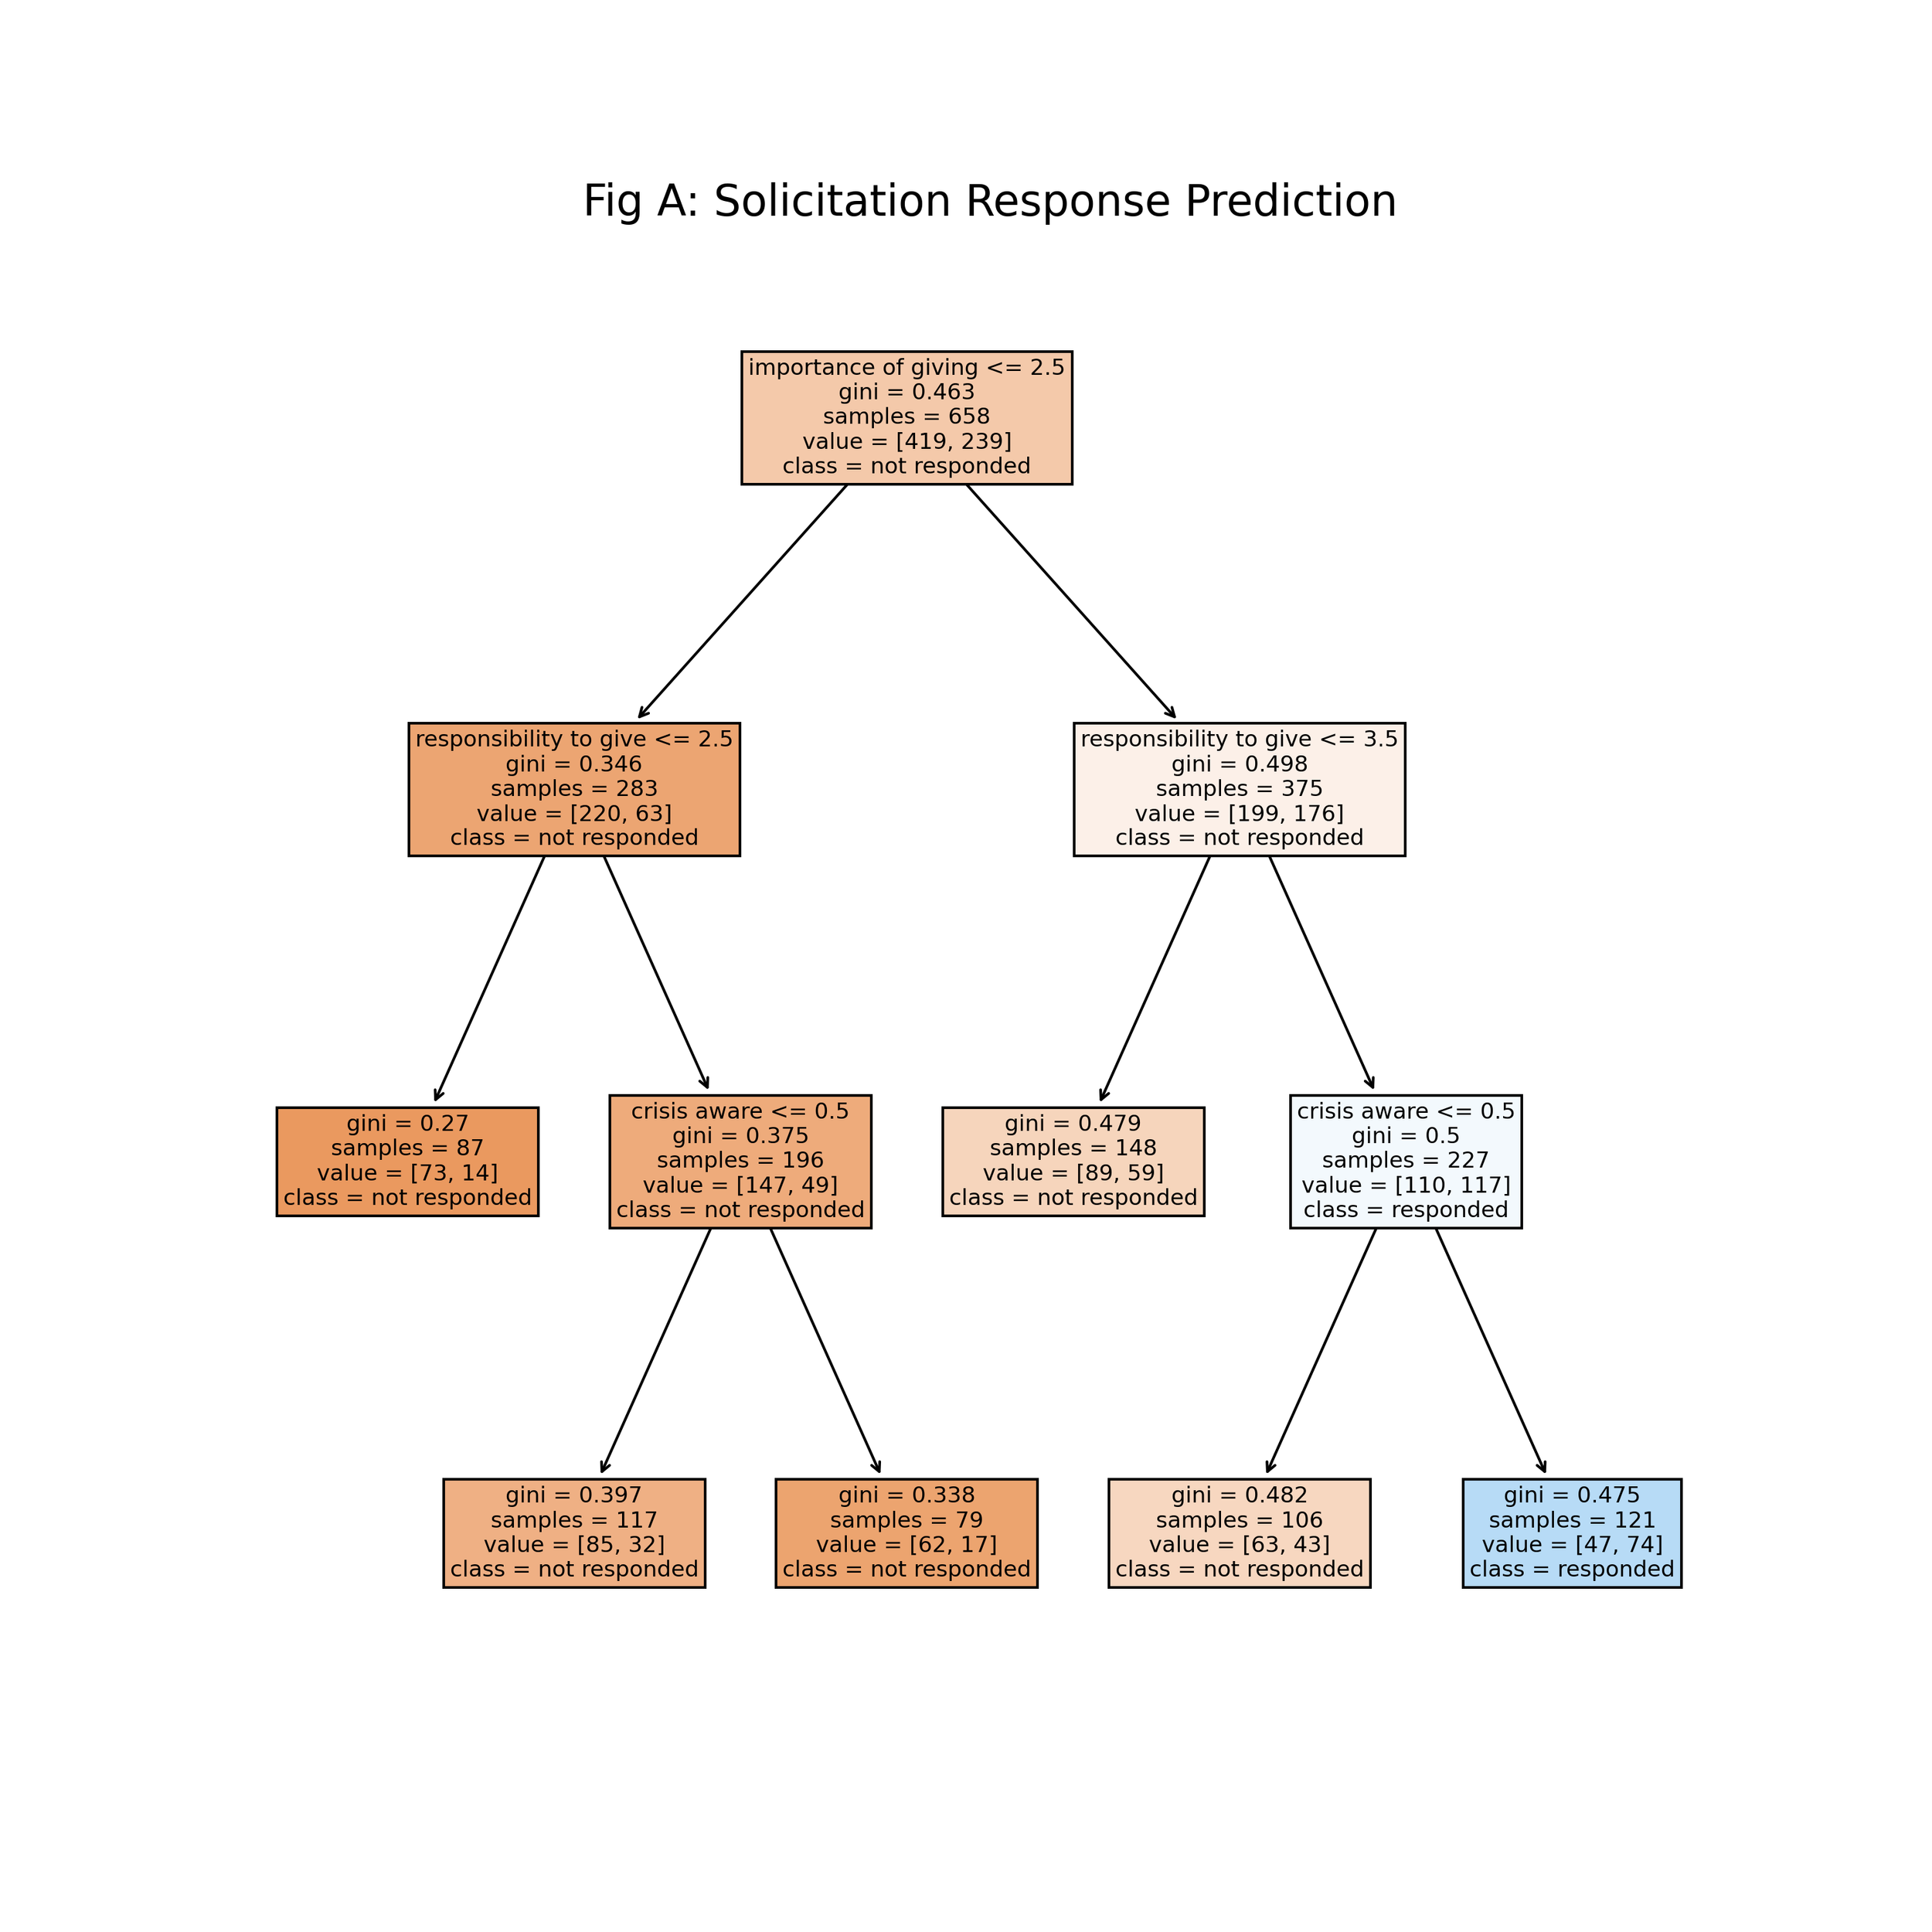
We attempt to predict unsolicited respondents’ propensity to respond using a decision tree, which is a flowchart-like model used to split respondents into increasingly homogenous groups with respect to an observed outcome, in this case response to solicitation. We train this model on the subgroup of respondents solicited in the past week to gain an understanding of which factors influenced an individual’s likelihood of responding, and then use this model to predict responses among the remaining unsolicited respondents.
We find that a combination of prosocial attitudes and awareness of a recent crisis are the best predictors of a generous response to solicitation among those solicited in the past week. Specifically, people who exhibited the following characteristics were the most likely to respond generously to a recent solicitation:
Reporting it is personally “very important” to them to help those in need (out of options “not important” or “moderately important”)
Strongly agreeing with the statement “I feel everyone has a responsibility to give and help those in need” (out of options “strongly disagree”, “somewhat disagree”, or “somewhat agree”)
Being aware of a new emerging crisis or disaster in the past seven days.

On the other hand, the predicted response rate (while a relatively conservative estimate) is still much lower than the response rate among those who were solicited in the past week (37%), implying that unsolicited folks do differ more fundamentally from those who were solicited beyond just their recent engagement with organizations. Given that prosociality is one of the main factors contributing to a predicted positive response, this speaks to the need to foster a stronger desire to help/give back among a large subset of the population, perhaps by engaging with individuals beyond directly asking for money.

Recurring Donors
Recurring donors in our sample appeared to fluctuate, and dipped below 25% of monetary donors for the first time since the beginning of 2023.

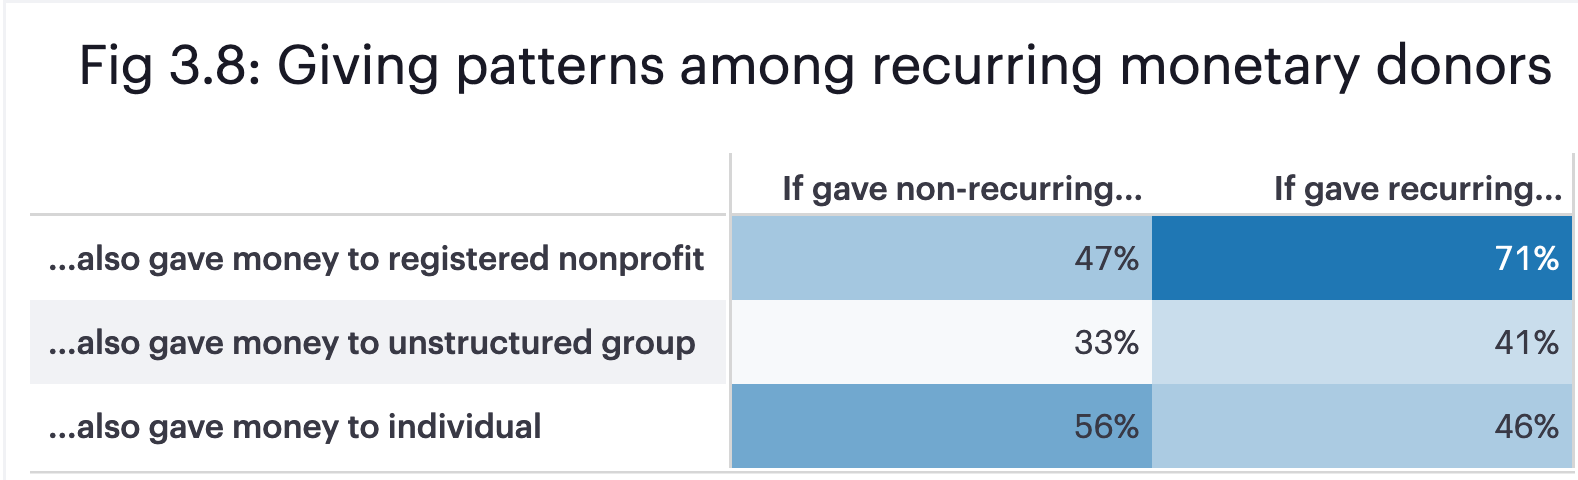
We looked at the breakdown between formal, informal, and individual recipients with recurring donations. As expected, the vast majority (71%) of those who gave recurring donations supported a registered nonprofit, however this leaves 29% of recurring givers who give only informally. Forty-one percent of recurring donors gave money to an informal group (in addition to or separately from any formal giving). This raises the question of how these informal groups organize to accept donations systematically. These groups might be collecting money through GoFundMe or a similar informal fundraising tool, or through cash at regular in-person events. Nearly half of those who give recurring donations are supporting individuals (either exclusively or alongside other recipients), perhaps by manually sending money at regular intervals.
During periods of increased recurring giving, registered charities are the entities that benefit the most. While 71% of recurring monetary givers gave money to a registered nonprofit in Q1, 95% of recurring donors more generally gave something to a registered nonprofit, compared with 78% of non-recurring monetary donors. Beyond money, recurring donors are more than twice as likely to report volunteering for a registered nonprofit than non-recurring donors and are significantly more likely to donate items formally as well. Giving to individuals does not differ significantly between recurring and non-recurring donors, either for money or in general. Recurring donors are a subgroup with particularly strong ties to formal organizations.

Workplace Giving
About 10-15% of respondents participate in giving via their employer, with the highest incidence (19%) reported in spring of 2023. The low incidence of workplace giving leads to more variability in our sample from week to week. However, from a quarter-to-quarter time frame, workplace giving was clearly down 20% compared to Q4.

Donation Methods

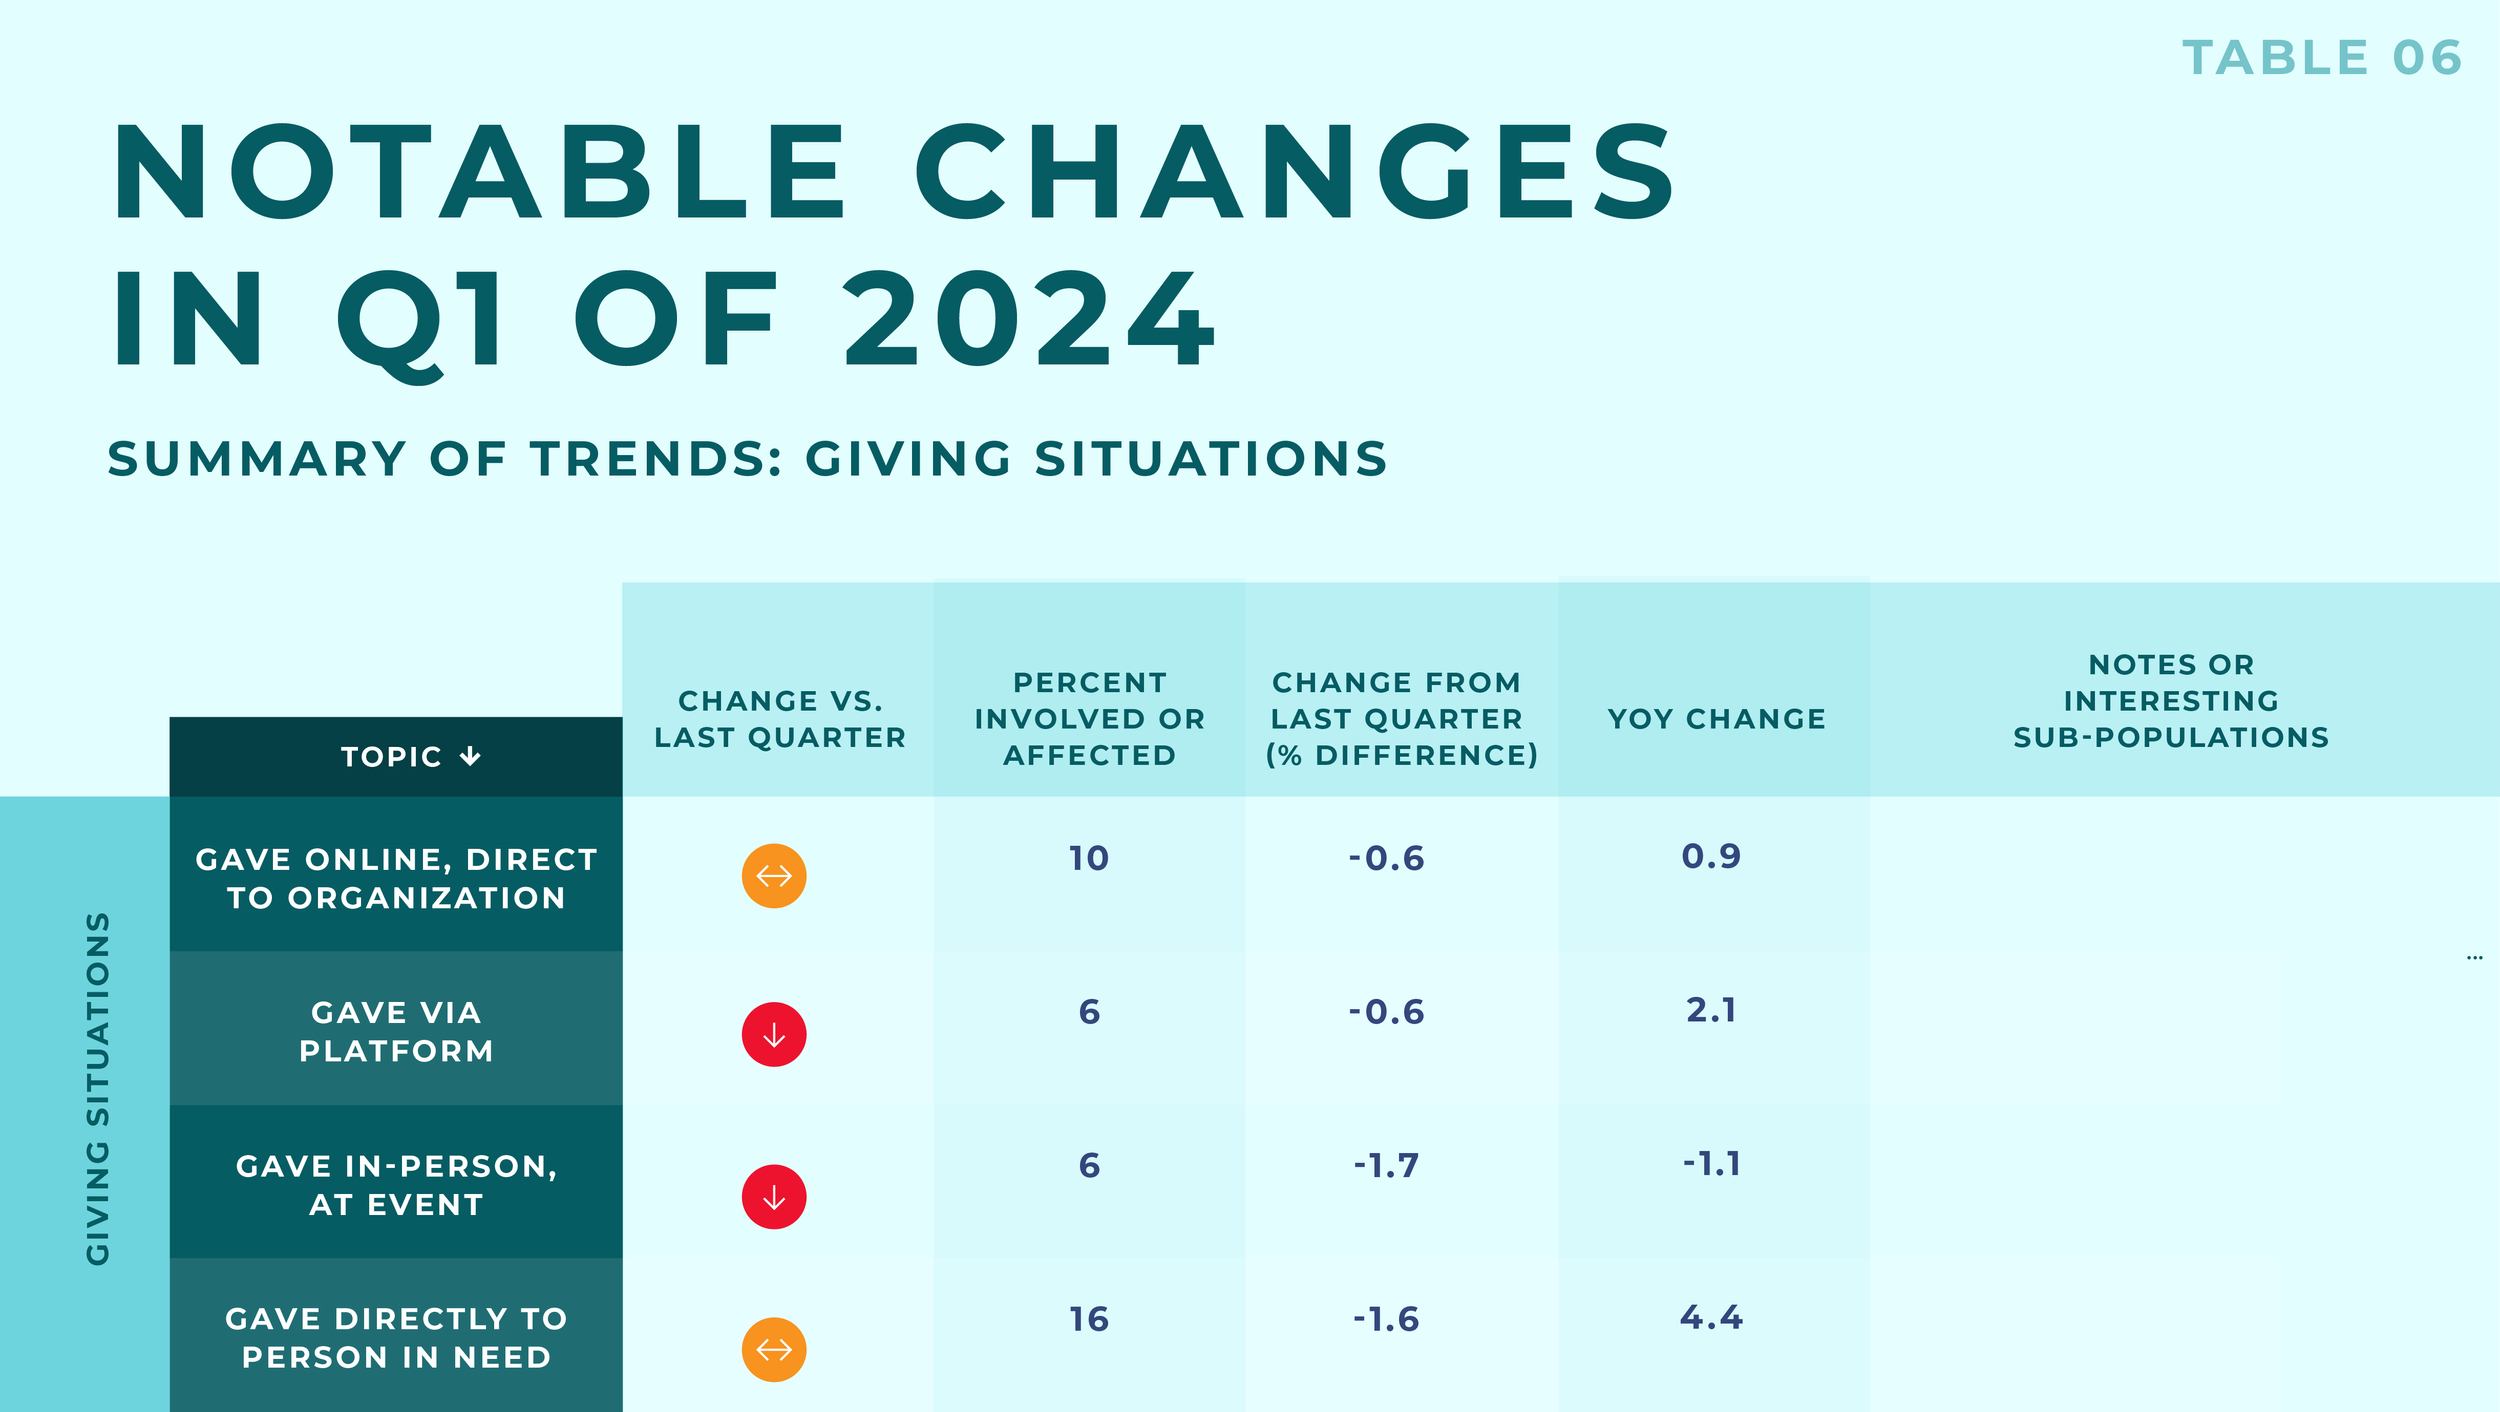
Donation methods did not change much in Q1 of 2024. With a few exceptions, people reported each of these modes at about the same rate in Q4 1-2% more prevalence for each. Giving directly to a person in need continues to be the dominant mode, nearly twice as common as online-direct or in-person event fundraising. Giving via a fundraising person and in a store dropped by 3 and 5 percentage points respectively, indicating a shift away from more formal in-person giving after the year-end giving season.

Part 4
Combining Behaviors with Beliefs and Attitudes: Generosity Profiles
Each quarter we use responses from the survey (except for demographic differences) to construct generosity profiles that capture differences in the population that cluster together. From one quarter to the next, these profiles tend to reflect the same underlying similarities in group behaviors and attitudes. The overall primary difference between these clusters is in how involved people are on a weekly basis. All of the Dedicated generosity profile (18%) and Activated generosity profiles (48%) practice some form of generosity; only 2% of the third profile - Low Activity (34%)- practiced any form of generosity when asked and comprise one-third of the total sample.
Whereas 40% of the Activated generosity profile recently gave in two or more of the four modes (money, items, time, advocacy), 98% of the Dedicated generosity profile gave in at least 2 ways. None of the Low Activity group gives in more than one form in a given week. Another notable difference between the Dedicated "many form" givers and the primarily single-form givers is that the latter tends to favor giving informally. Dedicated givers are more likely to decide "in the moment", are less likely to have given because they were solicited, and rarely participate in workplace giving or according to some preconceived plan. These tendencies have remained consistent over the past few quarters and continue to sharpen as the key distinction between "activated" and "dedicated" as we incorporate more relevant questions into our survey.


Characteristics of the Generosity Profiles
Another important way these giving profiles differ is in how they perceive the effects of their own generosity. When asked which one form of generosity they deemed most significant over the past year, the dedicated generosity group tended to say giving money. Those in the activated generosity profile chose giving items or giving money equally. Those in the low activity generosity profile were most likely to give no reason (skipping the question), and were least likely to cite advocacy as their most important mode, followed by volunteering.


Demographic and Identity Differences between Giving Profiles
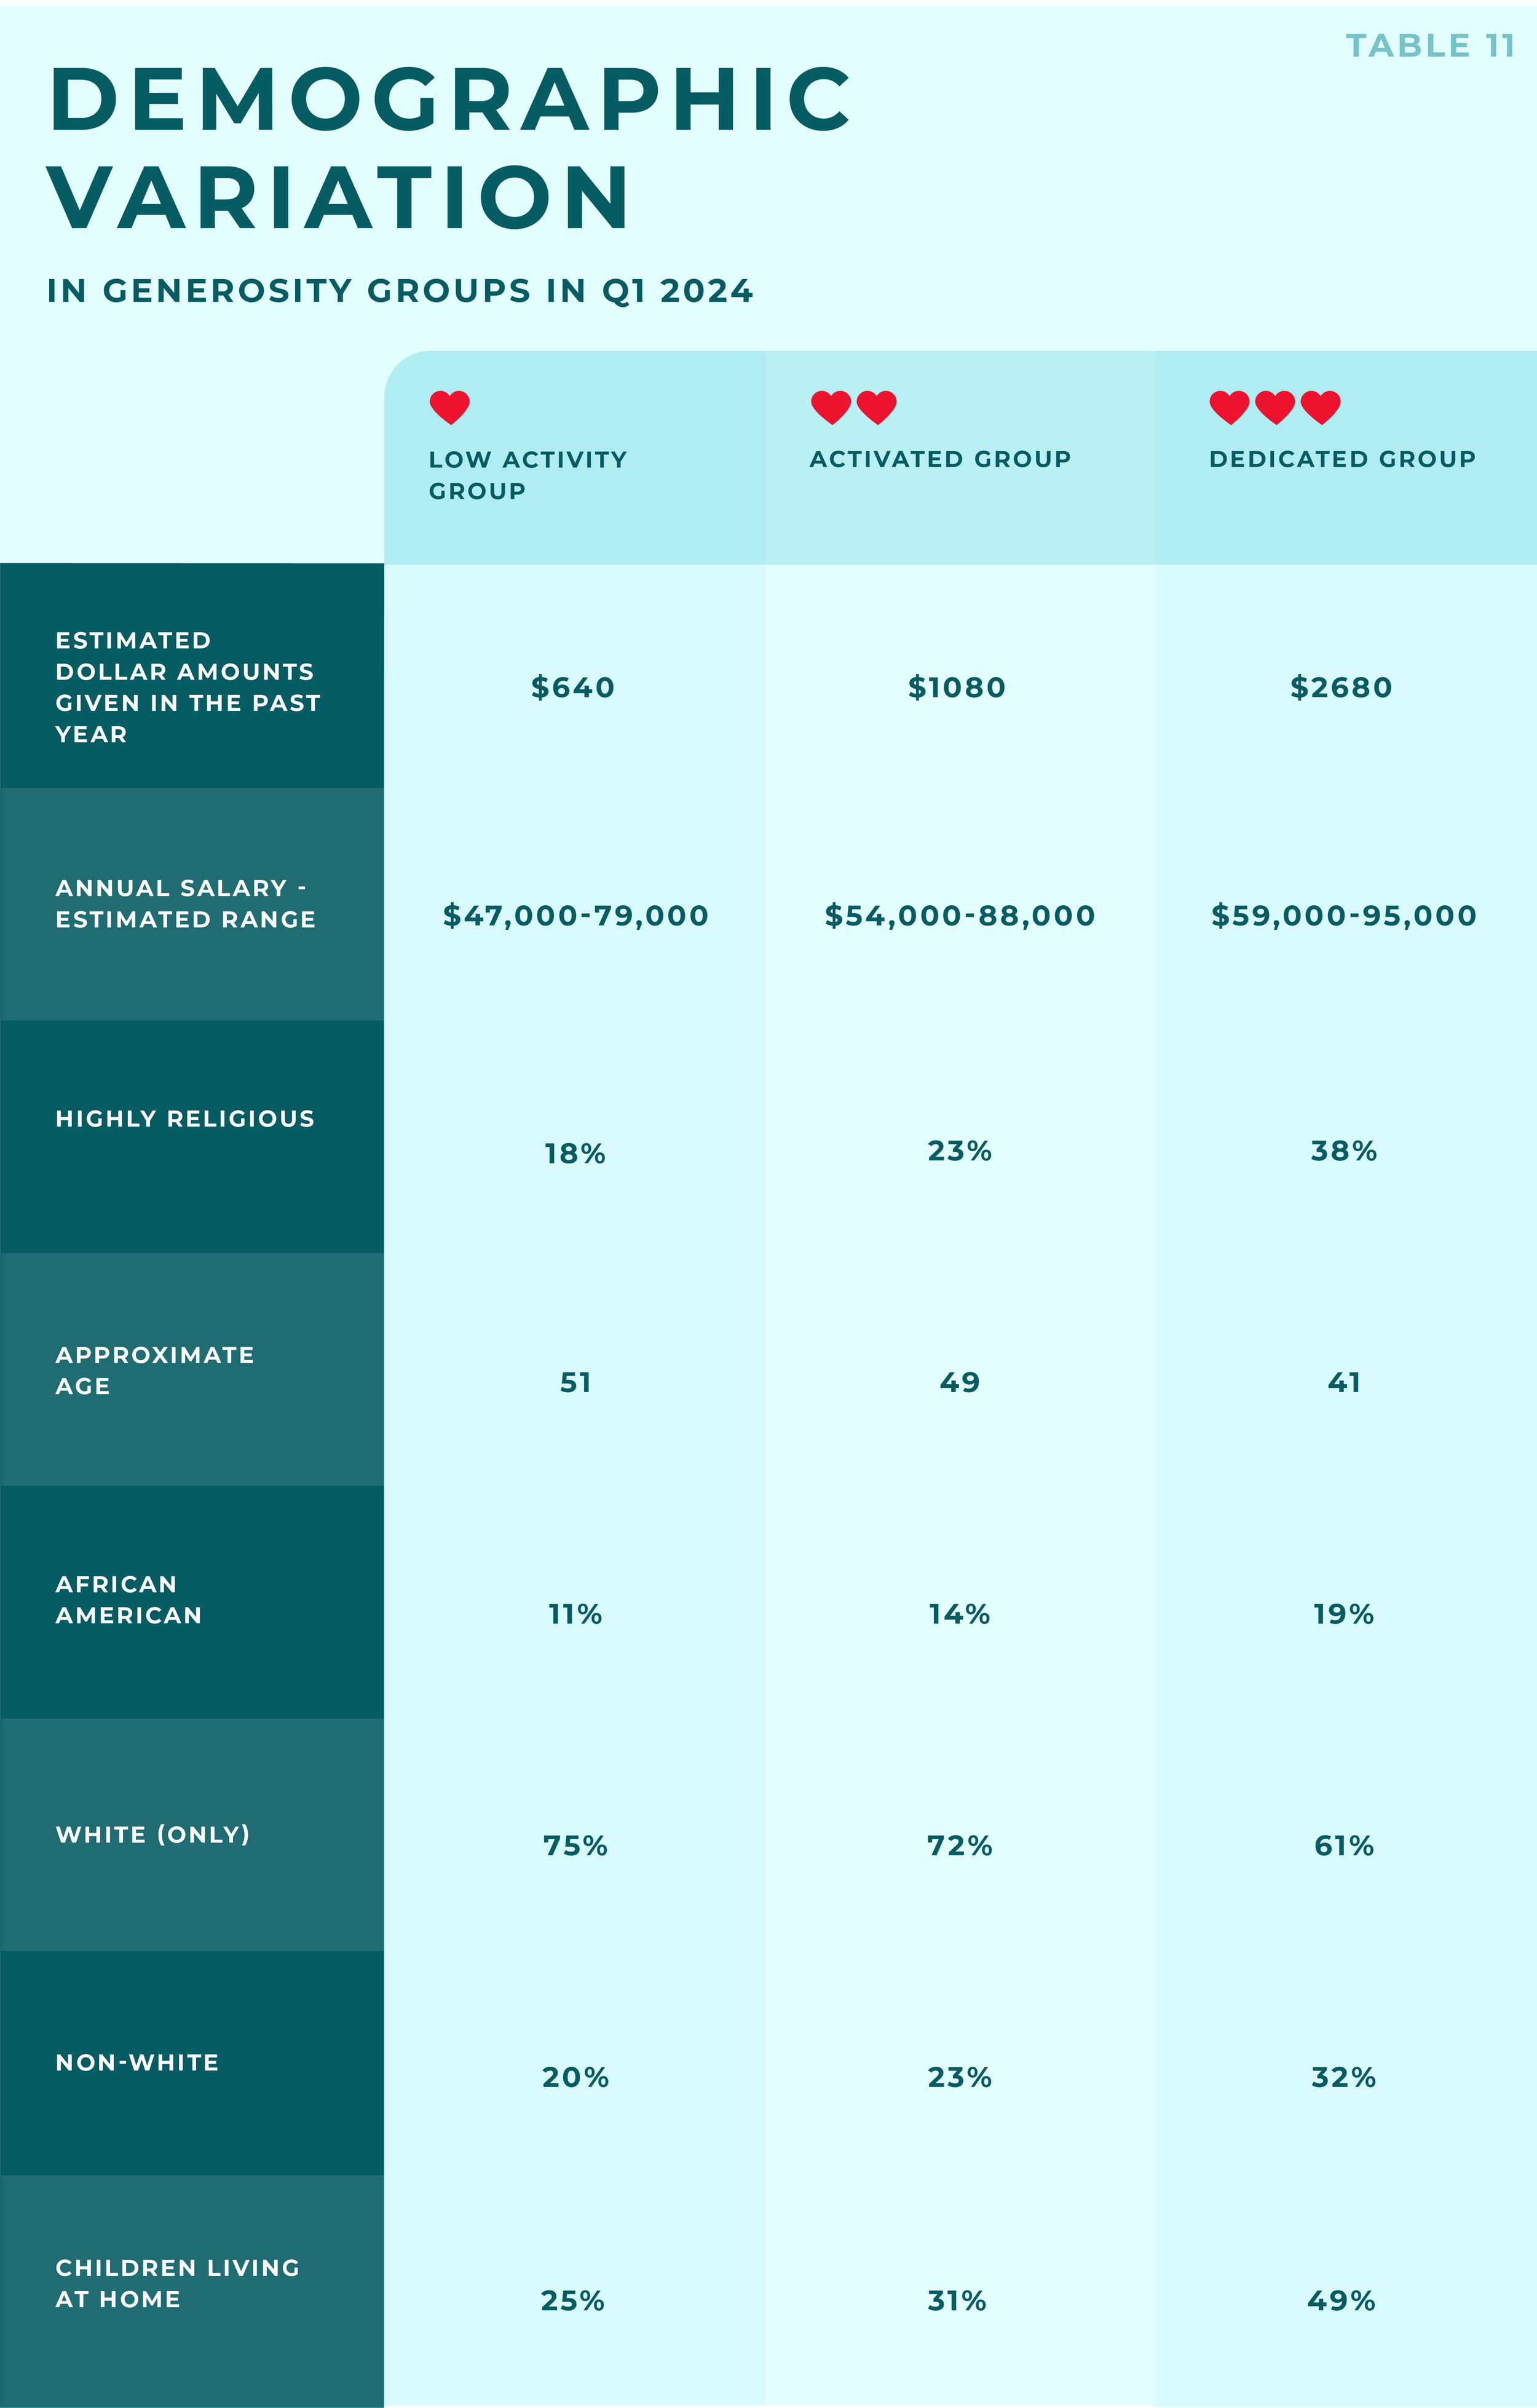
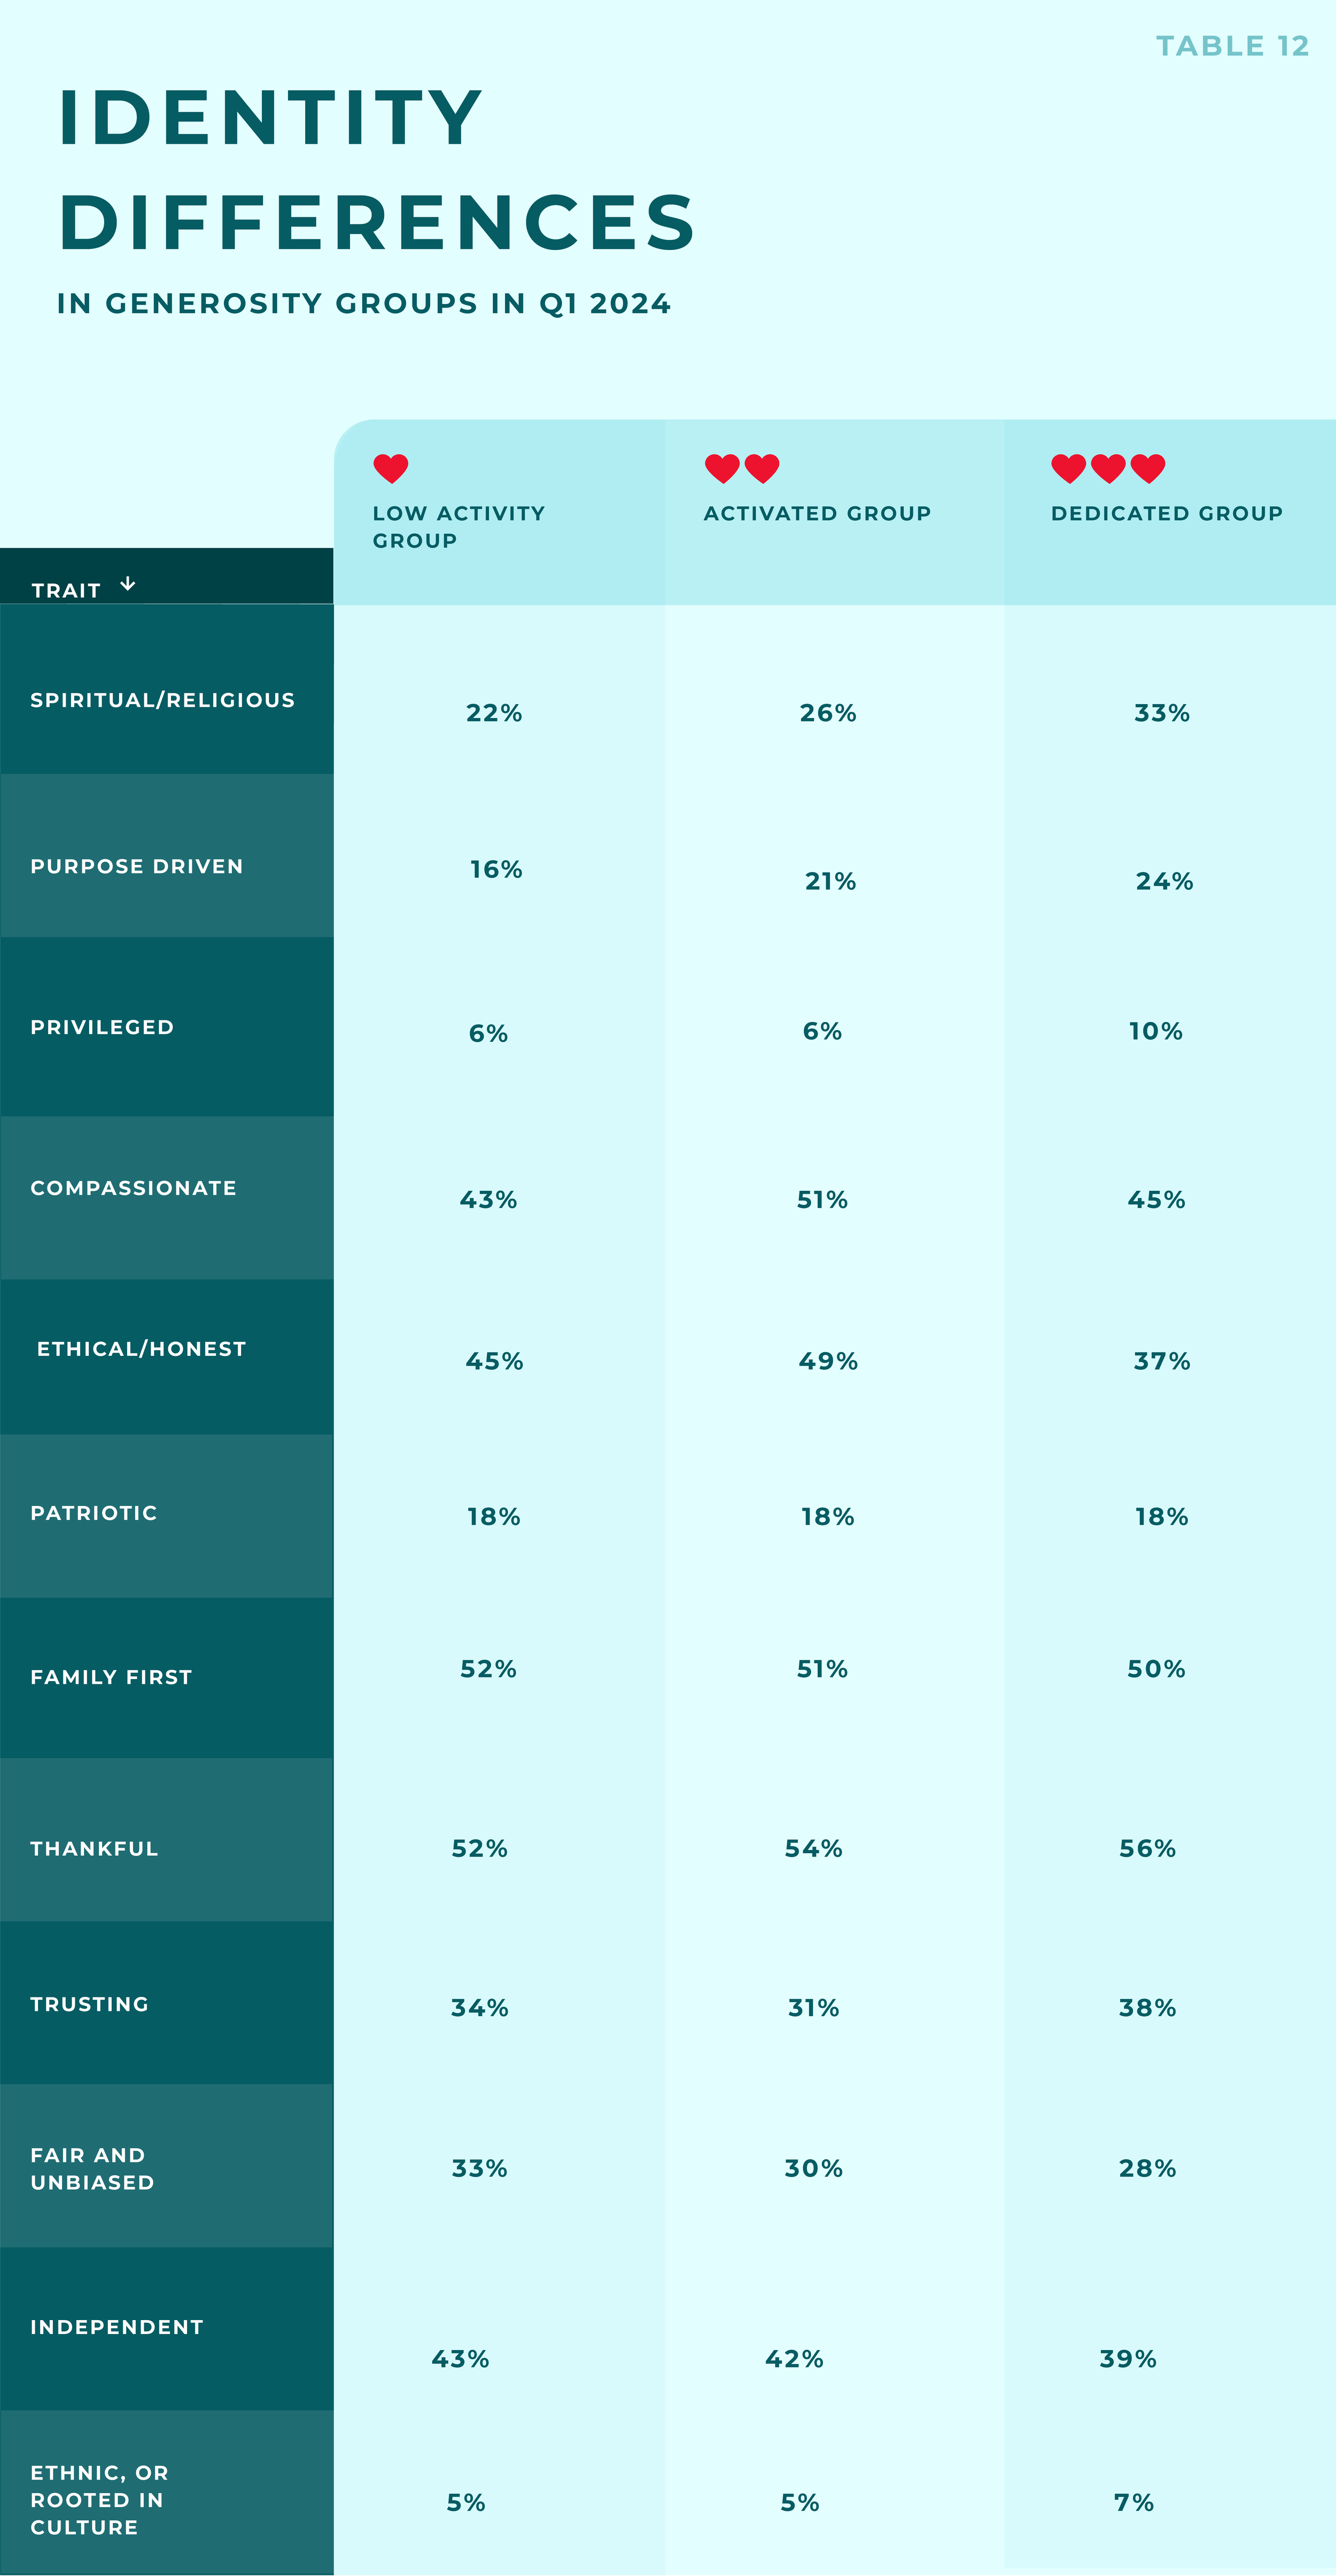
To augment self-identities, we asked respondents to select four from a potential twelve identity traits that best describe themselves. These provide a more nuanced lens into how these profiles see themselves interacting in the world, outside of one's worldview, politics, or feelings about nonprofits. This was introduced in Q4 2023, and the slight differences we observed between profiles in Q12024 remained consistent with what we observed in Q4.
Among these traits, only spiritual/religious, ethical/honest, and compassionate differed significantly between the giving profiles. Patriotic, "family first", and “thankful” were essentially the same between groups.
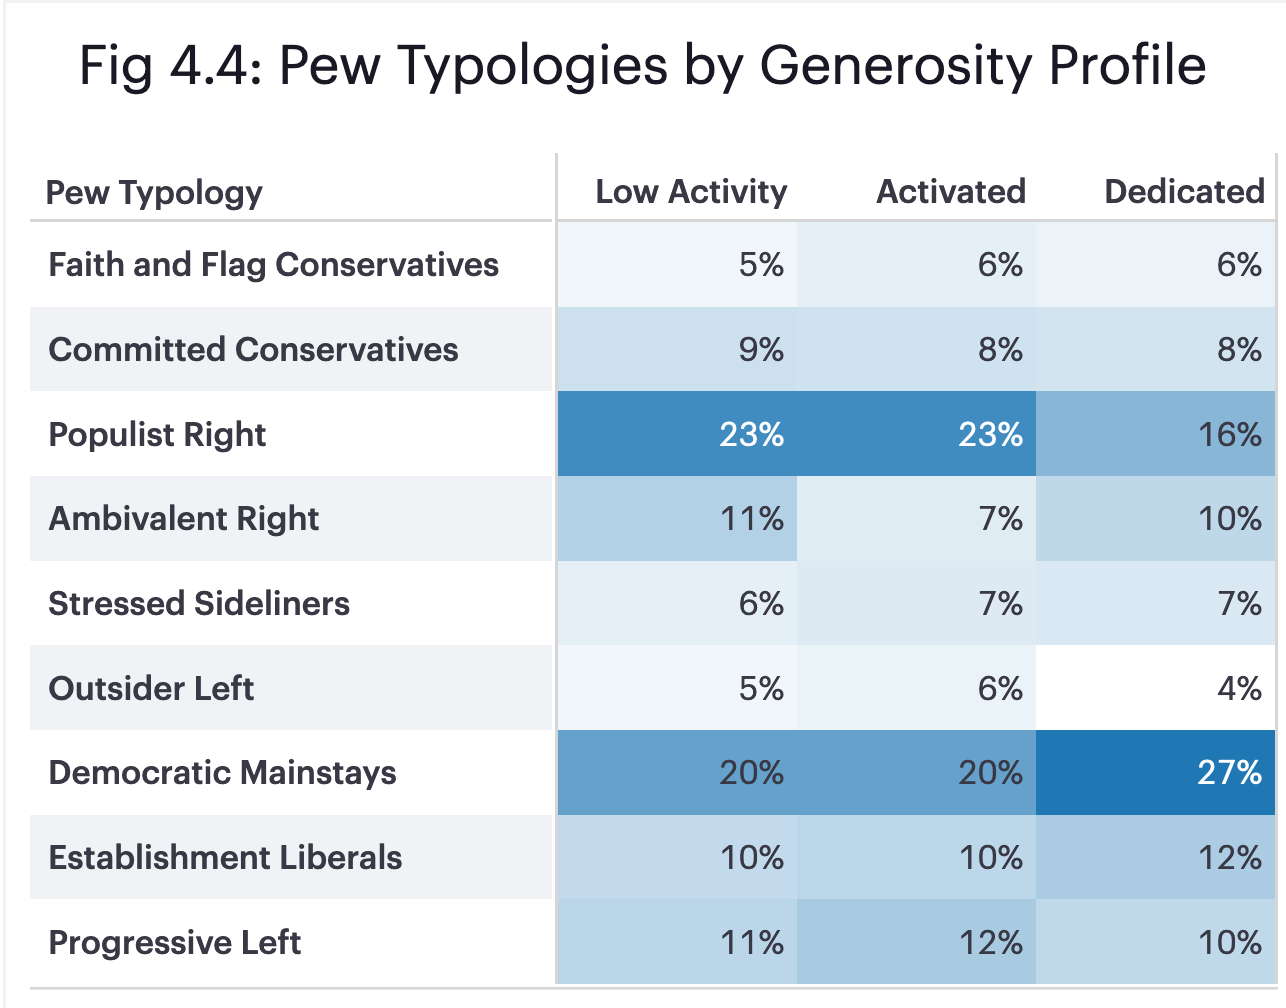
The affinity for informal giving among those in the center of the left-right political spectrum was first observed in Q4 2023, and maintained through Q1 2024. This quarter, informal giving was most common amongst the Ambivalent Right, where this behavior increased 6 percentage points over last quarter.

Advice for nonprofits:
You can tailor your email communications to appeal to people based on traits that seem to resonate with givers. Traits like "thankful" and "family first" seem to appeal to everyone
Purpose driven and Privileged showed a trend towards being more represented in the Dedicated generosity group. "Fair and unbiased" and Independent tended to be more represented in the Low Activity generosity profile. "Trusting" was highest in the Dedicated generosity profile, but lowest in the activated profile. In future surveys we will measure trust separately, for more clarity about who/what people trust.
Taken together, this paints a picture of the Dedicated profile as a group that is more likely to view the world through a spiritual and/or religious lens and not an ethical or moral lens. They are compassionate, thankful, and trusting, but not unusually so. Although most within this profile wouldn't self-identify this way, they are far more likely to see themselves as privileged compared to other profiles. The Activated profile is the most likely to see themselves as compassionate, as well as ethical and honest. They fall between the other profiles, where these traits differ. They might be the least trusting of the three groups, although this does not appear to extend to their trust in nonprofits, where they are significantly more trusting (76%) than those in the Low Activity group (58%). The Low Activity profile is no different from other, more generous groups when it comes to patriotism, family, trust, or being thankful. They are slightly more likely than the other two groups to see themselves as fair and unbiased, or independent, and they are the least spiritual/religious.

Part 5
Relationship between Giving and Volunteering
Looking at the subgroup of respondents who give money or volunteer, we find that giving money only is the most common activity reported within this group, while volunteering on its own or in addition to donating are relatively less common. The majority of monetary donors give only money and do not volunteer.

In order to measure how the relationship between giving money and volunteering shifts over time, we calculate the Jaccard score, which measures the size of the intersection of these two behaviors for a given week (the proportion of donors and volunteers who partake in both activities). Looking at the Jaccard score over time, we observe its value is highest when monetary giving is at its lowest point in Q1, around mid February. At this point, the overlap between donors and volunteers is greatest (45% of the subgroup), meaning that when donation rates dwindle overall, those who volunteer maintain their giving behaviors and are more likely to be retained as monetary donors. When monetary donation rates were at their lowest in Q1, volunteers made up over half (55%) of donors.


If we expand our view to look at the past year of activity, we observe the same phenomenon in Q1 2023. Volunteer rates peaked the week of February 6, 2023 (31%) while monetary giving rates were at a low point (37%). At this point half of donors and volunteers were engaged in both activities, and over 60% of donors were also volunteers. In Q3 when monetary donation rates were at some of their lowest for 2023 (34%) volunteers again made up the majority of the donor pool.
There are also periods of time where the relationship between these behaviors is strong because both are happening in abundance — particularly during the year-end giving season, but also in Q2 2023. This should not be discounted, however it does not detract from the fact that the relationship appears to be more driven by the act of volunteering than by the act of giving money. This result reflects that of the Do Good Institute’s Social Connectedness and Generosity report which finds that the influence of volunteering on giving is significantly greater than the influence of giving on volunteering. Volunteering retains donors, whereas donating has a much lesser effect on creating or retaining volunteers.

Part 6
How World Events and Crises Affect Giving
Crisis and Awareness
The crises most commonly reported by GivingPulse respondents in Q1 were the storms and flooding in the northeastern US in January (although awareness peaked and continued throughout February), and the 7.5 magnitude earthquake that hit the Noto Peninsula of Japan on January 1. The overall level of crisis awareness amongst GivingPulse respondents was relatively even this quarter compared with last. In Q4, the Israel-Hamas war was the predominant crisis following the attacks of October 7, 2023, however ongoing awareness of this conflict has dwindled since November. It is worth noting that while variations of the word “Israel” were the most commonly reported keywords in Q4 (about 20% of crisis-aware respondents), the terms “Gaza”, “Palestine”, or “Palestinian” appeared as keywords more commonly this quarter (7.6% of crisis-aware respondents) than “Israel” (10%), perhaps indicating a shift in focus within the broader context of the Israel-Hamas war.

While crisis awareness remained stable this quarter, generous response to crises dropped from 31% to 22%, a decline of nearly 30%. More concerningly, the shift appears to be towards ignoring crises, which increased in popularity overall and amongst those solicited (asked in the past week or past month), those who pre-planned their giving, and those who gave spontaneously. In fact, there are very few subgroups for which response to crises remained stable or increased between Q4 2023 and Q1 2024. Respondents under 25, those ignoring a recent solicitation, and those reporting awareness of the Israel-Hamas war are three of the only subgroups of respondents whose crisis response rate was similar to or greater than in Q4 (+6, +0, and +6 percentage points respectively).


Appendices
Appendix 1: Jaccard Score
The Jaccard score, also known as the Jaccard index or Jaccard similarity coefficient, is a metric used to measure the similarity between two datasets. It is particularly useful for binary data. It is defined as the size of the intersection of two sets divided by the size of their union:

In the context of generosity behaviors, the Jaccard score for the set of volunteers compared with the set of monetary donors would be the number of respondents who volunteer and donate, divided by the number of respondents who volunteer or donate.
Appendix 2: Decision Tree Methodology
A decision tree is a flowchart-like model used to split respondents up into increasingly homogenous groups with respect to an observed outcome. Internal nodes of the tree represent a binary division of the dataset at that node according to a characteristic of the input features. Branches from internal nodes represent the outcomes of that test, and leaf nodes represent the final decision or outcome classification based on all nodes and branches that lead to a given leaf.
A decision tree can be trained on a training dataset and then used to predict the same outcome on a new dataset. The predictive accuracy of a decision tree depends on the strength of the relationship between the input features and the outcome variable.
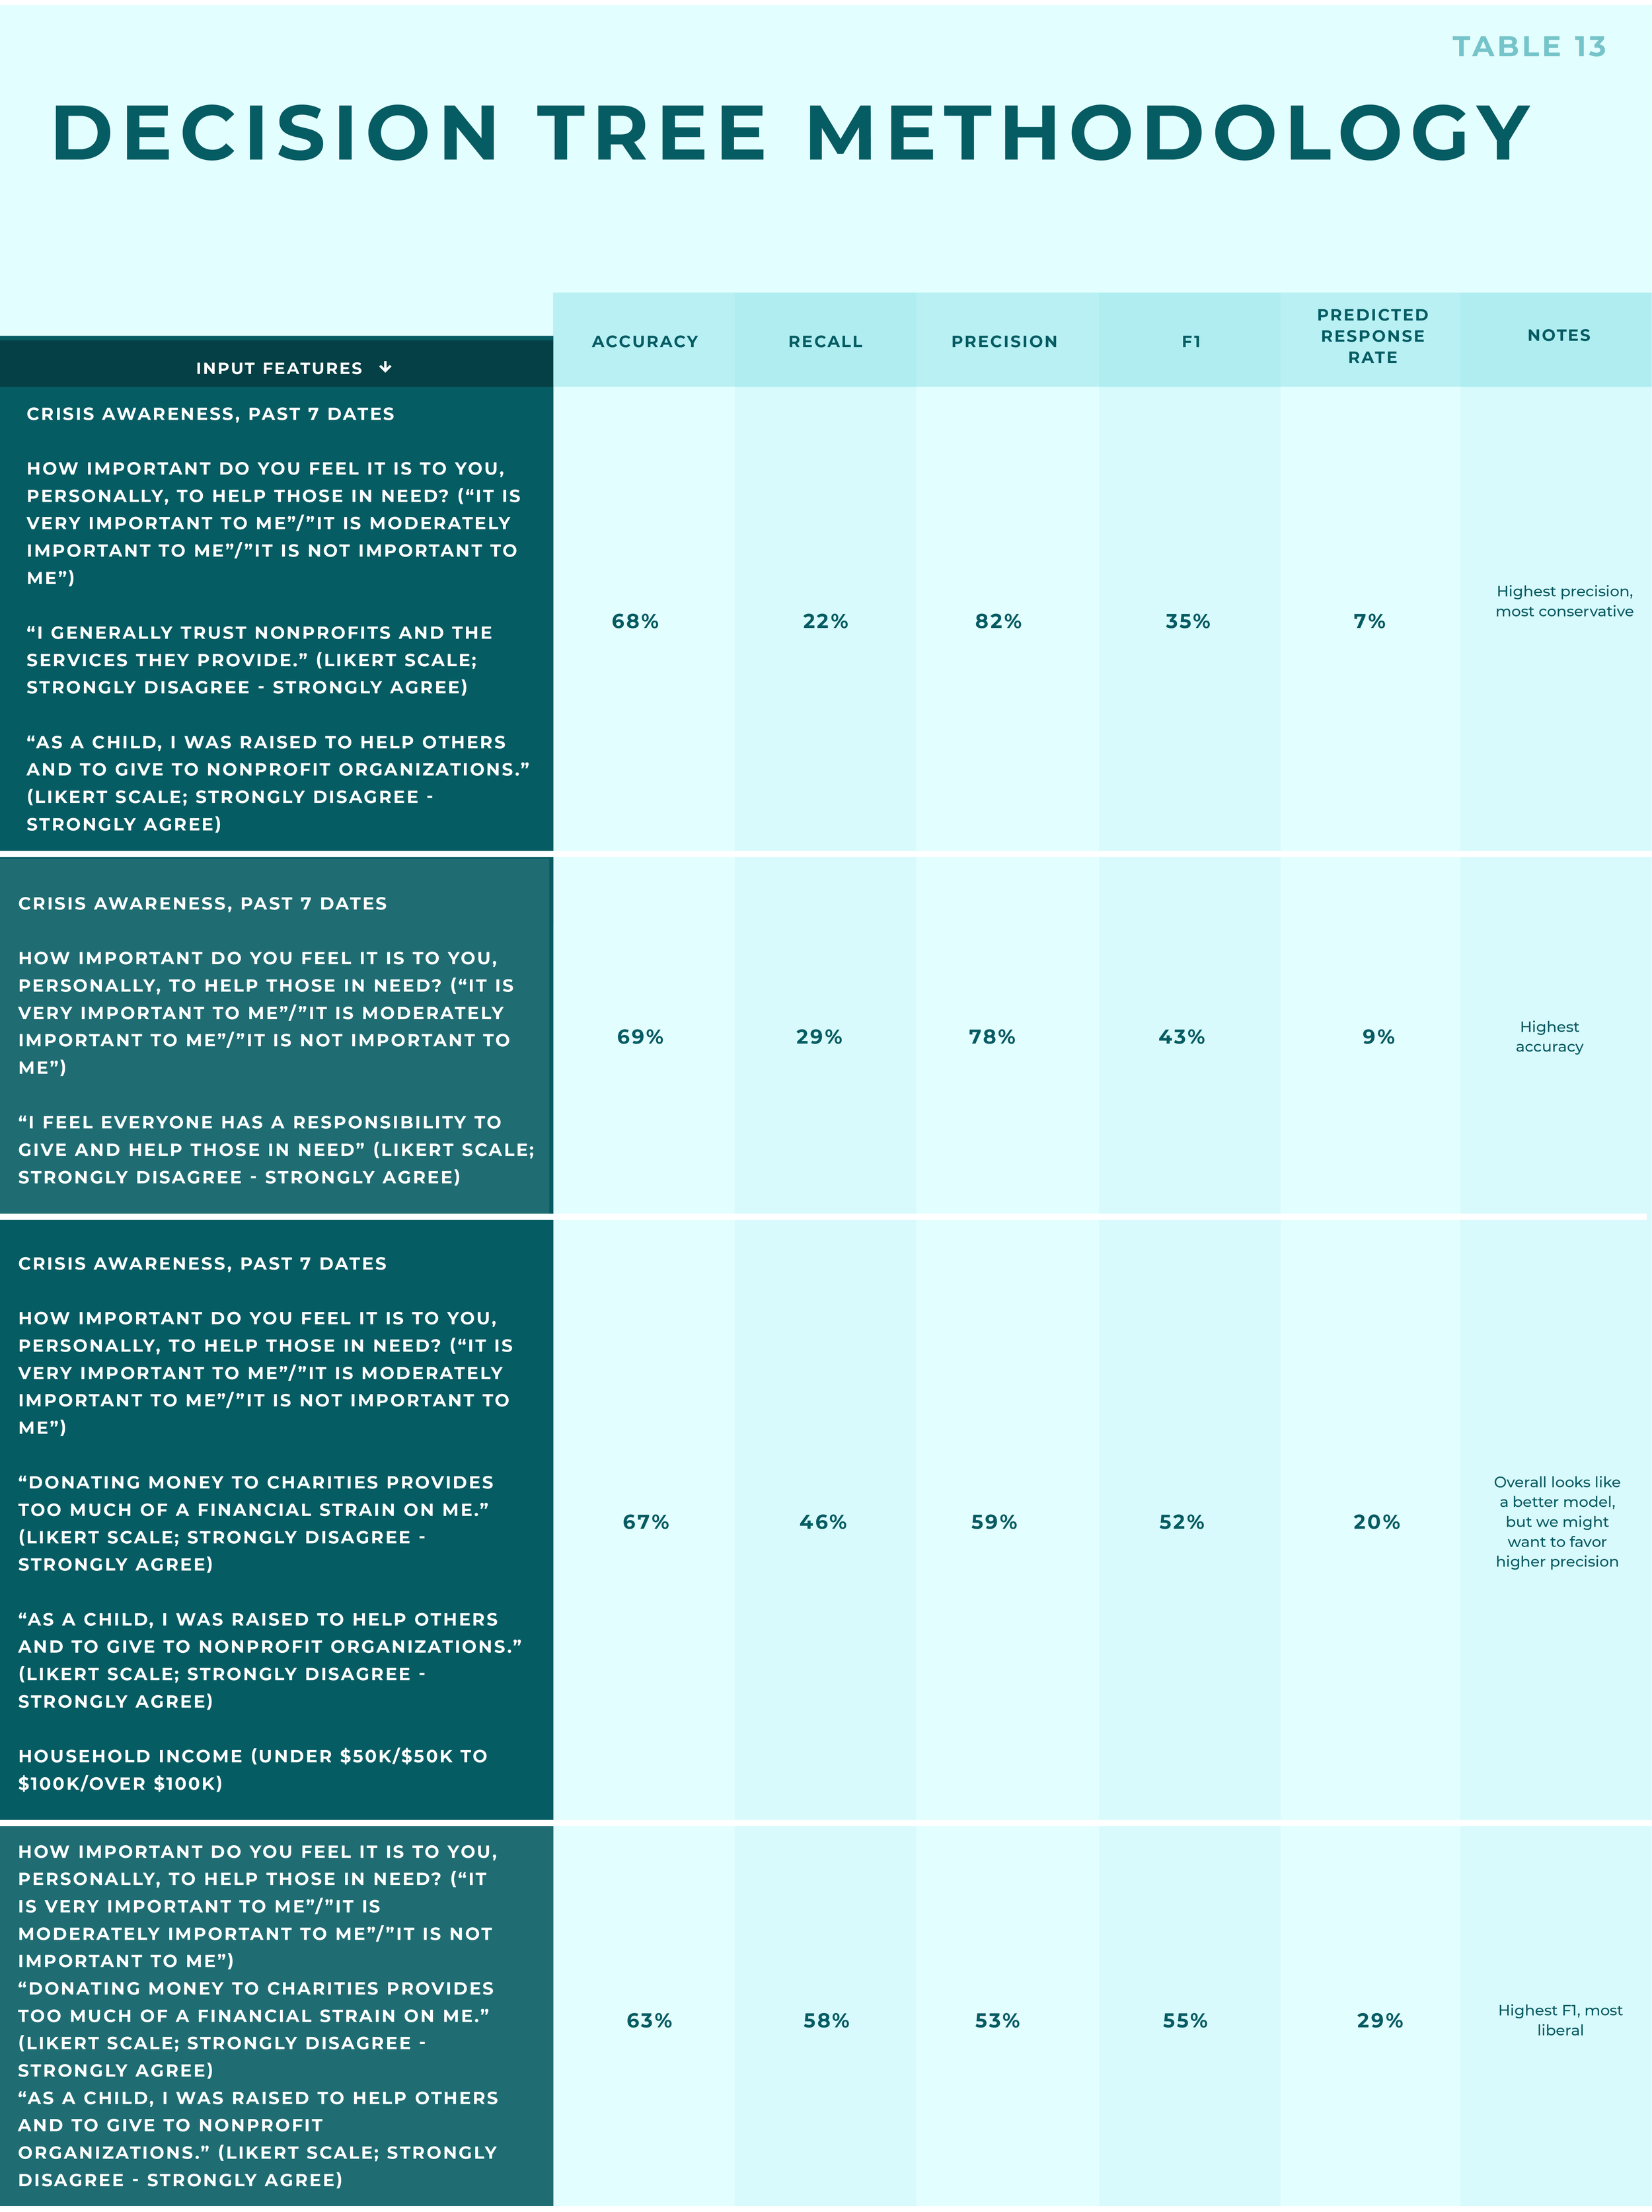
We tested several potential models for predicting response to solicitation among the unsolicited. The models were trained on a test dataset containing 67% of Q1 respondents who had been solicited in the past week. In table 13, the accuracy, recall, precision, and F1 values were computed for a test dataset containing the other 33%. The predicted response rate was calculated from the dataset containing all Q1 respondents who had not been solicited in the past week. Our selected model is in the second row.
Other input features were considered based on their relationship to solicitation response or to control for demographic traits. These include:
Awareness of recent positive news about charities
“I enjoy giving to nonprofits” (Likert scale response)
“I sometimes give because of peer pressure and/or to fit in with others.” (Likert scale response)
“I give because I feel a little guilty for the good fortune I have.” (Likert scale response)
“My decisions to help others often included input from family and/or others.” (Likert scale response)
Age
Religiosity
Gender
Family structure (children living at home versus not)
Occupation
The models we considered had a relatively low range of accuracy values (between 63% and 69%), but a wider range in the values of other performance metrics. Accordingly, the predicted response rates vary widely, between 7% and 29%.
In selecting the model used in our analysis, we favored one with a higher precision value, meaning that it is less likely to falsely classify someone as a responder than a non-responder. A 78% precision value means that of the responders classified by the model in the test dataset, 78% were true responders and 22% were non-responders that were misclassified. In our analysis, models with a higher precision value had a lower recall value, meaning that there are more responders in the dataset that were not identified as such by the model.
The combination of a high precision and low recall value mean that the predicted response rate among unsolicited GivingPulse respondents (9%) is a conservative estimate. Predicting response to solicitation among unsolicited folks is a challenging task, and we did not want to report an overly optimistic estimate from this exercise, particularly given that accuracy scores for all models remain below 70%. There also may be features of the unsolicited respondents that differ more fundamentally from solicited respondents that we cannot account for in our training data, or features that play a role in solicitation response that are not measured in the GivingPulse dataset.