


GivingPulse
2024 Year in Review
A holistic look at trends in giving behavior and perspectives in the U.S.

About the survey
Since 2022, GivingTuesday has conducted a weekly cross-sectional online survey of Americans that tracks generous actions in the past week and their associated attitudes and worldview. These findings relate to the year of 2024, and build on findings we’ve been publishing on a quarterly basis throughout the year. We have prepared an accompanying methodological note for all figures outlined here.

Key Takeaways: What We’re Learning in this Release
♥ We continue to find that levels of trust in the nonprofit sector, a sense of community belonging, and civic intent (a measure indicating a community-minded orientation, as well as a pattern of recent generosity) are consistent across the four main geographic regions of the U.S., as well as types of communities as identified by the American Communities Project.
♥ Negative news about nonprofits does not depress generosity. In fact, people who noticed coverage of nonprofits were more likely to be generous, regardless of whether the news they heard was positive or negative.
♥ We continue to observe that people are more likely to support causes, organizations, and people when they are asked. As the organizations in the nonprofit sector ramped up solicitation activities in the last quarter of 2024, this period remained vital to the resilience and health of the social sector and the communities it serves.
♥ People living in different regions of the U.S. experience different levels of solicitation to give. To drive more giving, there are opportunities to expand the reach of current solicitation efforts.

To get the most out of this report, don’t forget to consult our available data resources.
Summary
This GivingPulse report from the GivingTuesday Data Commons reinforces a critical insight: people are far more likely to be generous when asked. Nevertheless, significant portions of the U.S. population are not being reached with direct appeals. If nonprofits and fundraisers expanded their solicitation efforts to these high-potential, but currently untapped donors, we think the sector could unlock between $19 billion and $46 billion in additional contributions annually. These estimates, especially in the current context, highlight the urgent need for more targeted outreach strategies, ensuring that fundraising efforts extend beyond traditional donor bases to engage new supporters.
GivingPulse data also show some reasons for pursuing optimistic strategies. We find that trust in nonprofits and in other people remains consistently higher than for other institutions in the U.S., across all demographics and political affiliations. This provides a strong foundation for deeper community engagement. While negative news about the sector does not appear to dampen generosity, increased media coverage—whether positive or negative—is associated with higher giving rates. This suggests that visibility and awareness play a crucial role in donor behavior.
In sum, nonprofits can benefit from proactive storytelling, transparency, and leveraging media attention to build stronger connections with their communities.
Explanations of the methodology behind this analysis can be found in our Methodology Note.

“Our data reveals both a disconnect and an incredible opportunity. When people are asked to give, they overwhelmingly respond with generosity, yet significant portions of people are being left out—representing a potential $19-46 billion in additional giving annually. This offers a clear pathway to increased giving and stronger civic engagement, as our research also consistently shows that people surrounded by prompts and reminders to participate in generosity-related activities are not only more likely to participate but also demonstrate higher civic intent. By expanding efforts to engage with existing and potential supporters, nonprofits can simultaneously grow their impact while cultivating the connected, engaged communities that form the foundation of a thriving civil society.”
Solicitation and Giving Behaviors
We have modeled the potential monetary impact of reaching unsolicited populations, and continue to show that people are more likely to support causes, organizations, and people when they are asked. While we see inconsistent rates of solicitation throughout the year, we also see consistent rates of response to solicitation.

We wanted to model the potential value to the nonprofit sector of reaching currently unsolicited populations. We have previously shown that approximately 10% of unsolicited GivingPulse respondents have traits that indicate they would have responded generously to solicitation if asked recently. Using data from the US Consumer Expenditure Survey to approximate the average annual donation made by individuals of corresponding demographic profiles, we estimate that this group of potential responders represents a value of between $19 billion (under conservative assumptions) and $46 billion dollars (under more relaxed assumptions) that could be contributed to nonprofits, if these individuals were identified and asked.
We observe an increase in the recall of recent solicitations. We also saw an increase in the rate of people responding with generosity when asked, reaching 40% in Q4 (up 12% from Q3 and similar to Q4 2023). Overall, 13% of respondents reported being asked to give and having responded generously when asked. This same proportion was also seen in Q4 2023.
The relationship between being prompted to give and generosity remains strong regardless of time of year, with the correlation between levels of recall of solicitation and reported giving (including giving money) sitting above 0.5 for the past two years of data. This means that when there is more solicitation happening, there is also more generosity happening. During times of year when solicitation rates increase, generosity also increases.
As in previous years, participation in the generosity ecosystem increased near the end of 2024. Monetary giving was particularly popular this year-end giving season, increasing 21% compared with Q3 (more than last year’s 15% across the same timeframe), with the largest increase occurring in monetary giving to registered organizations.
13%
reported being asked to give and responded generously when asked.
$19-46B
could be contributed to nonprofits, if potential givers were identified and asked.
+21%
Monetary giving increased this year-end giving season, compared to Q3.
Civic Intent and Trust
Following up on our recent report on Civic Intent, we continue to find that levels of trust in the nonprofit sector and civic intent (having a set of beliefs indicating a community-minded orientation) don't vary much around the country. We found little variance in each of these measures among different community types as captured by the American Communities Project clusters or among different political affiliations, as captured by the Pew Political Typology framework.
A super-majority of people in every county-type say they trust nonprofits and the services they provide, with 85% to 95% agreeing across various county types. Counties in the Middle Suburbs cluster show the greatest proportion of people trusting nonprofits (95%). The lowest levels of trust are observed in Aging Farmlands and Evangelical Hubs, though still 85% say they trust nonprofits.
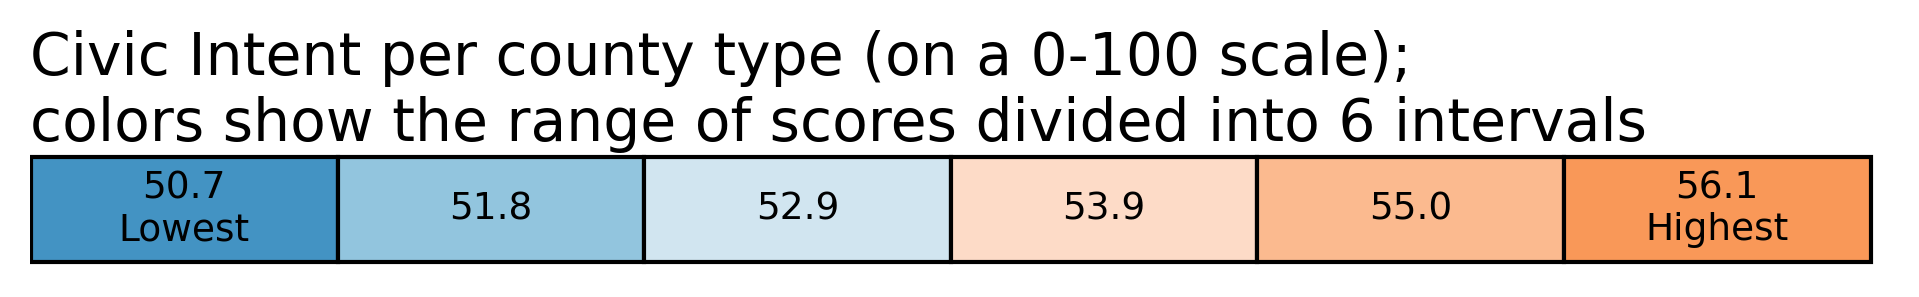
Civic Intent scores are practically the same in each county type. The highest averages are observed in Evangelical Hub counties (56 out of a possible 100), and the lowest are seen in Rural Middle America counties (51 out of a possible 100).
Regardless of where they live in the country, a majority of people agree that, in general, most people can be trusted. Urban Suburbs counties had the highest percent who trusted at 63%, while Rural Middle America counties were the lowest at 53%.
In contrast, nowhere in the country did a majority of people feel a sense of community belonging. Rural Middle America counties (representing rural areas mostly in the northern half of the U.S. from western New York to the Rockies) had the lowest average sense of belonging (35 out a possible 100). Counties in the African American South had the highest sense of belonging (47) with Big Cities counties and Graying America counties each scoring 45 out of a possible 100.
We continue to observe that generosity has limited relationships with an individual’s political affiliation (as measured by their Pew Political Typology). Between 60% and 70% of each political affiliation gave in some form in the past week, with the exception of the Ambivalent Right (center-right), of which only 52% gave.


Note: Counties in white (not shaded) are sparsely populated and did not have sufficient sample size to be included.

Solicitation and Community
People living in different regions of the U.S. experience different levels of solicitation to give. To drive more giving, there are opportunities to expand the reach of current solicitation efforts.


Note: Counties in white (not shaded) are sparsely populated and did not have sufficient sample size to be included.
Drawing on socio-economic clusters identified by the American Communities Project, we explored potential differences in solicitation and generosity across the U.S. We asked people if they were solicited to give, and separately, we track whether they gave.
In general, solicitation rates tend to be highest in big cities and suburbs, and decrease among counties with rural characteristics.
In most county types, people gave money at similar rates, ranging from 30% to 41%. However, the percent who were asked to give varied a bit more, ranging from 39% to a highest of 52%.
People in Exurbs (52%), Evangelical Hubs (52%), and Big Cities (50%) had the highest rates of solicitation.
People in the African American South (39%), Working Class Country (41%), Middle Suburbs (42%), and Hispanic Centers (42%) communities had the lowest rates of solicitation.
Particular segments of the population within these clusters are notable. In Working Class Country community types, only 35% of people under 35 recall being solicited. By contrast, in Rural Middle America 54% of those under 35 report being solicited.
In Evangelical Hubs, people over the age of 35 are 8% more likely to have been solicited. In Rural Middle America, people over 35 are 7% less likely to be solicited than the general population.
In two county types (Rural Middle America and African American South), we saw especially low rates of solicitation, despite having relatively high rates of giving in response to solicitation. In these two county types, very few people gave money if not asked (12% and 24% respectively), but the percentage who gave increased by 39% and 42%, respectively, when asked.
66-76%
say they trust nonprofits and the services they provide
60-70%
of each political affiliation gave in some form in the past week
53-63%
agree that, in general, most people can be trusted
Nonprofits and Public Perceptions
Negative news about nonprofits does not depress generosity. People who are aware of coverage of nonprofits are more likely to be generous, regardless of whether the news was positive or negative. Additional research could explore what factors explain this relationship, including whether those who are aware of nonprofit news are also more aware of current events in general.
Awareness of nonprofit news is consistently positively associated with generosity throughout our dataset, regardless of the sentiment of the news or the time of year. Since 2023, 85% of respondents who had recently heard something negative about nonprofits were givers, compared with 63% who had not heard something negative and gave.
In Q4 2024, we observe a substantial boost in awareness of both positive (+42%) and negative (+64%) news surrounding nonprofits after minimal mid-year shifts, a pattern which has not been observed previously.
Only a small percentage of people reported hearing only negative news: about 7% of those who heard any news, and 3% of all respondents, reported hearing exclusively negative news about nonprofits in Q4 2024. The vast majority of people who heard any news heard only positive news (74%), while about 1 in 5 heard both positive and negative.
