
GivingPulse
Q2 2024 Report
A holistic look at trends in giving behavior and perspectives in the U.S.
April to June 2024

Supported By:


Executive Summary
This report captures data and trends over the second quarter of 2024. In addition to providing some deep dives on key segments of the population, we continue to build on our holistic analysis of who is donating time, treasure, talent, or influence, and what motivates them to get and remain involved.
We note the following takeaways for Q2 2024:
♥ Overall Giving Declines; Informal Donations Hit Hardest: Giving dropped overall this quarter, with rates hitting their year-to-date low in all measured categories. Informal modes of giving – giving to unregistered groups or individuals – took the biggest hit this quarter, decreasing in incidence by 14% and 12% respectively.
♥ Solicitation Rates Drop; Generous Response Steady: Weekly and monthly solicitation rates also hit a year-to-date low in Q2. In particular, people under 30 were solicited at approximately the same rate while the solicitation rate of people over 30 (who are typically asked more frequently) dropped 14%. Crucially, the overall rate of generous response to solicitation remained consistent with Q1.
♥ In-Person Donations Fall; Online/Mobile Stable: The popularity of in-person methods of monetary donation has trended downward since Q4 2023, while online and mobile donation methods collectively have remained relatively constant over the same time period. Rates of in-person and online/mobile donations have now converged after the in-person donation rate had been trending about 10 percentage points higher for the past year.
♥ Crisis Response Rises; US-Based Donations Surge, International Giving Falls: Crisis response recovered from a low point in Q1, back up to 25%. Nearly 40% of individuals responding to crises this quarter directed their generosity towards US based but non-local recipients, and international giving among crisis response giving dropped substantially.
♥ Urban Donors More Generous; Suburban Favor Registered Groups: In Q2, we started asking respondents to identify as living in a more urban, suburban, or rural environment. We observe that those living in an urban setting are the most generous in all categories by varying margins, particularly for advocacy and giving to individuals. We also observe that respondents identifying as living in a suburban setting strongly prefer giving to registered organizations (42%), while individuals living in urban settings give nearly equally to registered organizations and individuals (46% and 44% respectively).
♥ Community Types Show Items Most Common; Money Prevails in Some Areas: Using respondents’ county of residence, we analyzed generosity using the American Communities Project community types. This model introduces 36 additional personal environmental factors that help contextualize generosity. In nearly all community types, giving items is the most common gift type by varying margins. The exceptions to this trend are Big Cities, the African American South, and Middle Suburbs where giving money is more common by a small margin.
“Trends from GivingPulse remind us that generosity is always evolving, influenced by how and where people live and by the challenges communities face both near and far. While challenges exist, a strong opportunity remains to strengthen connections between people and the causes they care about. We must adapt to these changing patterns, ensuring that generosity remains accessible and impactful, no matter the method or location. The spirit of generosity remains strong and holds immense promise for building resilience within the social sector in the coming months.”

To get the most out of this report, don’t forget to consult our available data resources.
Part 1
Generosity-Related Behaviors

Each week, we ask 100 people across the USA what generous actions they undertook within the previous 7 days, for a combined sample of 1200 people each quarter. These actions could include giving money, time (volunteering), items, or advocating for causes or groups. We also ask people to distinguish whether they gave to a formal registered charity, an informal group, or an individual, and whether they contributed locally, nationally, or internationally.
Each of the major types of generosity are shown below on a 4-week rolling basis covering Q2 2024.
Generosity in most forms dropped in Q2 2024 compared with Q1. Overall giving across all gift types and recipient subcategories hit their year-to-date low during this quarter. Volunteering is the only form of giving which, despite weekly fluctuations, remained similar in incidence to last quarter.
Looking at the past year of data, Q2 2023 was one of the most generous periods we have observed. We noted a substantial drop in all generosity behaviors compared to this quarter last year.
We observed fewer people engaged in advocacy this quarter, as it hit a nadir in the timeline of the GivingPulse dataset, with just 22% of respondents engaging in advocacy overall. The weekly advocacy rate hit a record low of 15% at the end of April. Participation in advocacy dropped at least 10% (1 to 2 percentage points) for all recipient types compared with Q1, and rates dropped by over a third compared with Q2 2023 (when 33% of people participated in advocacy).

Corresponding to the drop in generosity overall, fewer people gave, and those who did give gave in fewer ways. Those who did give were more likely to do so in only one way compared with previous quarters. This is particularly pronounced with recipient types, where giving to a single form of recipient increased 7 percentage points up to 45% of respondents.


Giving by Formality
Informal giving – generosity directed towards individuals and unregistered groups – took the biggest hit in Q2, while giving to registered organizations was similar to Q1 2024. Monetary giving, item donation, and volunteering for registered nonprofits remained relatively unchanged this quarter compared with last. Given that the level of giving overall hit its lowest point in the past five quarters – 57% of respondents – in Q2 2024, this highlights the importance of informal giving in the broader context of generosity. Informal giving constitutes many respondents’ main contributions to their communities, and if they elect not to give or are limited in their ability to do so, we observe a drop in giving overall.

We will monitor this trend in the coming months to understand if this is indicative of a larger shift. Given that the vast majority of people who engage in informal giving also give to registered organizations (≥ 70% this quarter; Fig 1.6), this will be an important issue to monitor.

Giving by Locality

The regional distribution of giving remains relatively stable this quarter. International giving dropped this quarter to 5% of givers down from 8% in Q1, with a corresponding slight shift towards local and regional giving. We expect that this is due to the nature of crises that occurred this quarter compared with last (see Part 6).

Part 2
Generosity Trends at a Glance


Part 3
Key Groups of Interest
Solicited vs. Unsolicited Respondents
The drop in generosity observed this quarter corresponds to a year-to-date low in solicitation, with the monthly solicitation rate down 12% from Q1 and the weekly solicitation rate down 11%. The monthly solicitation rate dipped below 40% this quarter for the first time since Q4 2022.
Crucially, response to solicitation was similar to previous quarters, with about 35% of solicited individuals responding generously to a recent ask. However with noticeably less asks this quarter, a consistent response is not enough to maintain levels of generosity recorded previously.
In the second quarter, solicitation rates for people under 30 remained steady at approximately 24% on a weekly basis. In contrast, solicitation of those over 30, who are typically more highly solicited, dropped by 14% to match the rate of their younger counterparts at 25%. Specifically, the weekly solicitation rate among individuals over 50 decreased from 31% in Q1 to 26% this quarter. People who were aware of a recent crisis reported being solicited at about the same rate as in the previous quarter. Young people responded at higher rates compared to Q1. Larger monetary donors (those giving over $1,000 in the past year), decreased slightly (by 5%) compared with last quarter.


Last quarter, we looked at predicting response to solicitation among the unsolicited subset of the GivingPulse sample and found that an additional 7% of respondents exhibited traits that would make them likely to respond to a solicitation if they had been asked recently. This prediction was based on an individual’s recent crisis awareness and their level of prosociality – thinking it is personally “very important” to them to help those in need, and feeling everyone has a responsibility to give and help those in need. Revisiting the same model using this quarter’s data, we find that it performs similarly, predicting that approximately 8% of unsolicited respondents, or 6% of the sample overall, would have responded generously to solicitation if asked in the past week. For more details, see our Q1 2024 report.
Two interesting differences emerged in the relationship between peoples’ attitudes and their propensity to respond to solicitation this quarter compared with last.
49% of people who reported consulting friends and family when deciding to give responded this quarter
57% of people who reported giving due to peer pressure or to fit in with others responded this quarter
Neither of these traits were significantly associated with response last quarter, but are strongly associated with response in Q2. In addition to pro-social attitudes, awareness of crises, and trust in nonprofits (all traits that continue to be associated with responding to solicitation), respondents’ relationships with their peers appear to be a strong driver of engagement recently.


For GivingPulse analyses, we generally consider an individual to have been solicited if the solicitation occurred within the previous week. However, for this specific analysis, unless otherwise indicated, we define “solicited” as an individual who has been solicited in the previous month, to increase the scope of potentially relevant behaviors. This definition encompasses people who reported being solicited in the previous week and those who were solicited between one and four weeks prior to data collection.

Recurring Donors
Unlike other types of giving, recurring giving is stable among monetary donors this quarter. Similar to other behaviors, it appears as though the rate of recurring giving was higher in Q2 2023 (peaking above 40% of monetary donors) but has since stabilized at around 30% over the past year. Q3 was a low point for recurring donor rates in 2023, and it remains to be seen if this trend will be observed again next quarter.

There was a shift in the types of recipients supported by non-recurring donors this quarter. Typically, supporting individuals is the most commonly reported behavior amongst non-recurring donors (56% in Q1 2023, 55% in Q4 2023), however this quarter, supporting registered organizations was the most common behavior amongst recurring and non-recurring monetary donors alike, while non-recurring support of individuals dropped 12 percentage points compared with last quarter and non-recurring support of registered organizations increased 11 percentage points. While this matches overall trends in informal giving this quarter, it is interesting that the shift extends this strongly to subgroups that typically differ in the formality of their giving.


Workplace Giving
Workplace giving hit an all time low this quarter overall, continuing a downward trend since Q4 2023. Compared with Q2 2023, workplace giving has dropped by nearly half, from 16% of respondents down to 9%. With employees vacationing over the summer, it is difficult to foresee this rate recovering in the near future (workplace giving rates were at their lowest in late summer and early fall last year too), but this may be a key area for donor acquisition or recapture in Q4, particularly as it relates to organizations’ #GivingTuesday efforts.

Donation Methods

There were some interesting shifts in monetary donation method use this quarter. The top donation methods remain the same as in previous quarters, however in-person methods of donating – giving at a live event or religious service, giving directly to a person in need, and giving in-store – all dropped by 10% or more compared with last quarter, while giving online directly and indirectly saw more minimal changes.
Examining forms of online and in-person donation in aggregate, we see that the gap in incidence between these forms of donation were lower than average throughout all of Q2 2024 due to drops in in-person engagement; typically, in-person monetary donation rates are about 20 percentage points higher than online donation rates and the disparity reached a maximum of 35 percentage points in Q4 2023, but in Q2 the difference sat around 11 points throughout the quarter.
Interestingly, giving via mail saw a dramatic increase of 36% compared with last quarter, becoming the fourth most common way of giving in Q2. One of the subgroups in which this increase was most pronounced was respondents with a household income under $50,000 per year, in which reports of donating by mail doubled this quarter (7% to 14%).


Combining Behaviors with Beliefs and Attitudes: Generosity Profiles
Part 4
Each quarter we use responses from the survey (except for demographic differences) to construct generosity profiles that capture differences in the population that cluster together. From one quarter to the next, these profiles tend to reflect the same underlying similarities in group behaviors and attitudes. The overall primary difference between these clusters is in how involved people are on a weekly basis. All of the Dedicated generosity profile (18%) and Activated generosity profiles (44%) practice some form of generosity; only 3% of the third profile - Low Activity (38%)- practiced any form of generosity when asked.
In Q2, the size of the Low Activity profile increased from 34% to 38% while the Activated profile dropped from 48% to 44% reflecting the decline in generous activity observed this quarter.
The Dedicated profile remained steady at 18% of the GivingPulse sample. The level of generosity of individuals in this profile also remained consistent with last quarter – 96% gave to a registered charity, 83% gave items, 98% volunteered or advocated, and 38% engaged in workplace giving. Some of these figures dropped in Q1 following the 2023 year-end giving season, but they have remained stable from Q1 into Q2.

One area in which this profile has decreased is giving to new charities: only a third of Dedicated respondents reported supporting a new charity or group this quarter, compared to nearly a half last quarter. Support for new groups remained stable among members of the Activated profile, so despite maintaining their overall generosity, Dedicated respondents appear not to have reached as many new recipients this quarter.
Solicitation dropped 5 to 6 percentage points within each profile, reflecting a 6 point drop in solicitation in the sample overall. It is interesting to note that this drop was distributed uniformly across all generosity profiles. Even though the Dedicated profile is consistently solicited more in all quarters studied, people with all levels of generosity recall being asked to give less this quarter. There is room for improvement across the board here, or perhaps a need for more targeted asking, accurate segmentation, and reallocation of resources.
Characteristics of the Generosity Profiles


Demographic and Identity Differences between Giving Profiles


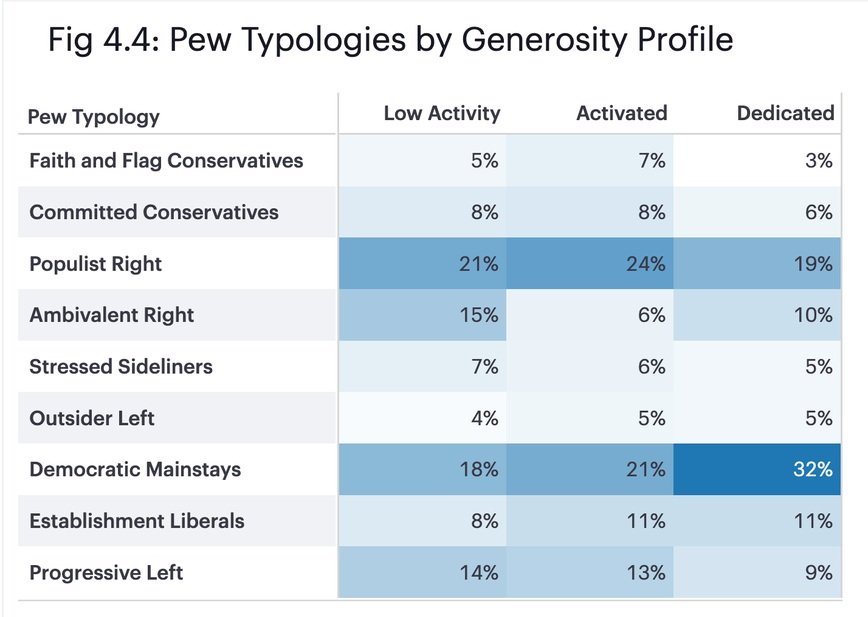
The political ideologies of individuals in the Activated profile remains consistent with previous quarters. We observe slightly higher representation of Democratic Mainstays in the Dedicated profile (32%) compared with last quarter, and a corresponding drop in individuals on the far right in the Faith and Flag Conservatives and Committed Conservatives groups, now collectively making up 9% of the Dedicated profile compared to 14% last quarter.
We also see that the Low Activity profile contains significantly more individuals belonging to the Ambivalent Right than either other profile (15%). 26% of this profile now fits into one of three relatively politically centrist Pew political typologies, more than any other profile. It will be interesting to observe how the relative polarization of the generosity profiles evolves in the run up to the US presidential election in November, to see if any trends emerge in political polarization and level generous activity. As in previous quarters, we still observe that those closer to the center of the political spectrum tend to give more informally than those at the extremes.


This quarter, we collected data on respondents’ county of residence and used this to assign each individual to their American Communities Project community type in order to gain a more nuanced and detailed view of the composition of each profile. Specifically, our hope was to gain a better understanding of what features define individuals whose behavior falls into the Low Activity profile.
Surprisingly, we find that the distribution of county types between each generosity profile is nearly identical. The only community type in which there was a significant difference (p < 0.05) in the distribution of generosity profile members was the Exurbs.
Generosity Profiles and Community Types


These communities sit just outside of major urban centers, are characterized by high median income, above average levels of education, and strongly Republican politics. About half as many Exurbs inhabitants were grouped into the Dedicated profile compared with the Low Activity and Activated profiles. This corresponds to a slightly (though not significantly) higher representation of those living in the Big Cities community type in the Dedicated profile. A key factor that appears to set the Dedicated profile apart in its behaviors, both by way of community type and urban versus suburban distribution (Fig 4.6), is density. The Exurbs, with their sprawl, wealth, and “lengthy, solo commutes”, are a community type defined to a degree by isolation, and it is possible that this does not generate the social conditions for the elevated generosity of the Dedicated profile to take place. The Exurbs (and suburban areas more generally) are also notably less diverse, whereas the most generous members of the GivingPulse sample are typically younger and more ethnically diverse than their counterparts. While the core, Activated donor may be found in the suburbs, radical generosity in all its forms appears to be fostered in America’s large urban centers.
Beyond the Exurbs, no one ACP community type is more or less activated (overall) than others. While it may have been desirable to identify a “least activated” or “most activated” community type, it’s not that simple. People across economic, political, and cultural, and geographic contexts engage in generosity.
In Q2 2024, we added additional questions to the GivingPulse survey to gain a better understanding of the geographic distribution and socioeconomic, political, and cultural context in which each respondent resides. These two new questions track the respondent’s US county of residence, and allow the respondent to self-identify as residing in a more urban, suburban, or rural community.
About half (51%) of the GivingPulse sample this quarter identifies as living in a suburban neighborhood, and 29% identify as living in an urban setting. This leaves 20% living in rural areas, which matches the 2020 US census estimate (the Census Bureau does not distinguish between urban and suburban, but the approximately 50-30-20 split does match a 2018 analysis by Pew Research Center on trends across suburban, urban, and rural US communities).

Looking at generosity by degree of urbanization, we see that those living in an urban setting are the most generous in all categories by varying margins. This is most pronounced (and statistically significant) in the categories of advocacy, giving to individuals, and “other” types of giving, broadly defined. We also observe that respondents identifying as living in a suburban setting strongly prefer giving to registered organizations (42%) compared to informal groups or individuals (29% each). The disparity between recipient types is less pronounced among respondents in either rural or urban settings, with individuals living in urban settings giving nearly equally to registered organizations and individuals (46% and 44% respectively).

Looking at our county data, we assign each respondent to their corresponding community type based on the American Communities Project (ACP). The ACP is an initiative out of the Michigan State University’s School of Journalism that uses demographic, socioeconomic, political, and consumer survey data to group US counties into 15 distinct community types based on shared characteristics unrelated to their geographic proximity to each other. Full descriptions of each community type as well as a map of counties pertaining to each type can be found on the ACP website. This analysis represents our first exploration of generosity within the community types, and we hope to pursue more in-depth analysis as we accumulate greater sub-group sample size.

Following the US population distribution, the most highly represented community types in the GivingPulse sample are Big Cities and Urban Suburbs. Big Cities, Exurbs, and Middle Suburbs are overrepresented in the sample, while Hispanic Centers, the African American South, Working Class Country, Evangelical Hubs, and Military Posts are under-represented to varying extents. All sample community type proportions are within +/- 2 absolute percentage points of the population distribution. There were a total of less than 30 respondents in each of LDS Enclaves, Native American Lands, and Aging Farmlands this quarter. These community types have been excluded from this analysis.


The community types on this chart are ordered from largest population (top) to smallest (bottom). Three have been removed due to insufficient sample size (n < 30): LDS Enclaves, Aging Farmlands, and Native American Lands. These are also the three smallest subgroups of the US population.
In nearly all community types, giving items is the most common gift type by varying margins. The exceptions to this trend are Big Cities, the African American South, and Middle Suburbs where giving money is more common by a small margin (less than 5 percentage points). Graying America, characterized by a significant elderly population, displayed high levels of volunteerism (28%), reflecting the community's demographic profile. Conversely, Hispanic Centers, which showed high levels of giving money, items, and advocacy, reported the lowest volunteerism rates (17%).

Across the general population and most community types, giving to a registered organization was the most common form of generosity. However, there were notable exceptions:
In Military Posts, informal community groups were preferred over registered organizations, likely due to the strong sense of military community identity.
Evangelical Hubs favored giving to individuals over non-profits, displaying the lowest rate of giving to registered non-profits among all community types surveyed.
Exurbs, Middle Suburbs, and Rural Middle America displayed a preference for formal giving, with respective margins of +4%, +11%, and +17%.
Some interesting trends emerge in relation to solicitation as well.
People living in Military Posts, Rural Middle America, and Graying America are being solicited the most frequently of any community type (between 30% and 34% of respondents asked in the past week).
Evangelical Hubs and Working Class Country are the two community types that are least engaged with registered non-profits, but present large differences in terms of solicitation rate. Working Class Country is the least frequently solicited community type, with only 11% of residents solicited in the past week, while Evangelical Hubs are solicited at a rate similar to the sample average (26%).
Only 12% of the African American South were solicited in the past week in Q2, and the majority of people in this community type report giving without being solicited when asked about their recent generosity. Hispanic Centers are solicited slightly more often (20% in the past week) but 45% report giving without solicitation recently.
In College Towns, 23% of people have been solicited in the past week but 51% have been solicited in the past month, the highest rate of any community type. This indicates that respondents in College Towns are being asked regularly but less frequently than other community types.
Rural Middle America, despite its strong emphasis on formal giving, exhibited slightly lower trust in non-profits (64%) compared to the sample average (71%). Additionally, volunteering (26%) and advocacy (23%) were more popular in this community type, with a significant portion of generosity directed towards local causes (79%) and none towards international ones.
Middle Suburbs, while relatively low in overall generosity, were among the few community types that favored formal over informal giving. Unlike other types, only a third of respondents in these areas reported giving for religious purposes or consulting family and friends when deciding to give. Interestingly, a third of respondents also reported giving beyond their local community, suggesting a preference for supporting larger organizations with a wider geographic reach.
Exurb communities favored giving to formal charities. Despite the affluence of these areas, the proportion of people who gave in any form this quarter was relatively low (58%), the third lowest of any community. However, when they did give, they preferred registered organizations, and notably, Exurbs were the only community type where a majority (57%) reported pre-planning their generosity.


Graying America places heavy emphasis on non-monetary giving, both on a weekly basis and overall (39% report that their main contribution in the past year was giving items). This is also the group that finds the most difficulty in making a donation to a nonprofit with only 76% saying it is “so easy” to make a donation to a nonprofit nowadays, 10 percentage points less than the overall sample. Planned or legacy giving is an obvious approach within this demographic, but ongoing relationship building in non monetary forms appears to be a preference of community members.
The African American South community type presents an interesting combination of generosity traits. This group engages relatively equally in formal and informal giving. They have a strong preference for giving money, both in terms of recent behavior and in terms of their self-perceived “most significant” contribution in the past year – 37% chose donating money, compared with only 23% who chose giving items, the lowest incidence of any community type. Nearly one in five respondents report directing their contributions to international causes or recipients. Yet a quarter of this sub-group reports intending to reduce the amount they donate in the next year, so retention appears to be an issue.
Opportunities
Military Posts show a strong affinity for giving to community groups instead of giving to formal charities or even giving peer-to-peer. There may be opportunities to engage with this community type via existing identity-based community groups or using non-traditional forms of giving like giving circles.
While people living in Evangelical Hubs support each other in many ways, they are generally disengaged from the formal non-profit ecosystem. This parallels a broader sense of disconnection from systems of power, as evidenced by low voter turnout (59% in 2020) and high agreement with statements such as “experts in this country don’t understand the lives of people like me” (71%). To engage this group, localization and long-term, ongoing community involvement are essential to gaining credibility.
The Working Class Country shares similar traits with Evangelical Hubs, but are noticeably under engaged by nonprofits compared with Evangelical Hubs (and all other community types). Only 29% of respondents recalled being solicited in the past month (compared to a sample average of 44%), and only 44% reported seeing reminders or publicity for giving (compared to 64% overall). Beyond just localizing messaging and support, nonprofits need to start showing up and making themselves more known in these communities more than others.

Big Cities and Urban Suburbs show high levels of positive sentiment towards, trust in, and engagement with non-profit organizations, but this is likely not news. A potentially more novel opportunity for growth lies within College Towns, who exhibit similar attitudinal traits as larger urban and suburban areas but have higher levels of informal engagement and place less emphasis on monetary giving. People living in these areas are already aware of sector activities (51% solicited in the past month, 71% report regularly seeing reminders or publicity to give) and almost half (46%) say they could afford to give more, so there is room for increased conversion and establishing lasting relationships within a young population.
Many people in Hispanic Centers give money but about half of respondents in this community type report that they experience financial strain from giving to nonprofits and only 32% said they could afford to give more than they do already (compared with 46% overall). Monetary giving does not appear to be an area for growth in these communities, but the youthfulness (26% of the population is under 18), strong community and family orientation (half say that they take input from family and friends when deciding to help other), and high religiosity (62% say giving is part of their religious duty) of Hispanic Centers makes them a key community type to watch.
Donors in the African American South show a strong preference for giving money, but retention or growth in these communities may be a concern. Existing donors may benefit from more flexible giving options. Alternately, high levels of informal support and a strong community and religious orientation imply that a more grassroots approach may be preferable to engage with the African American South.
Part 5
Geographical Analysis
Part 6
How World Events and Crises Affect Giving
Crisis and Awareness
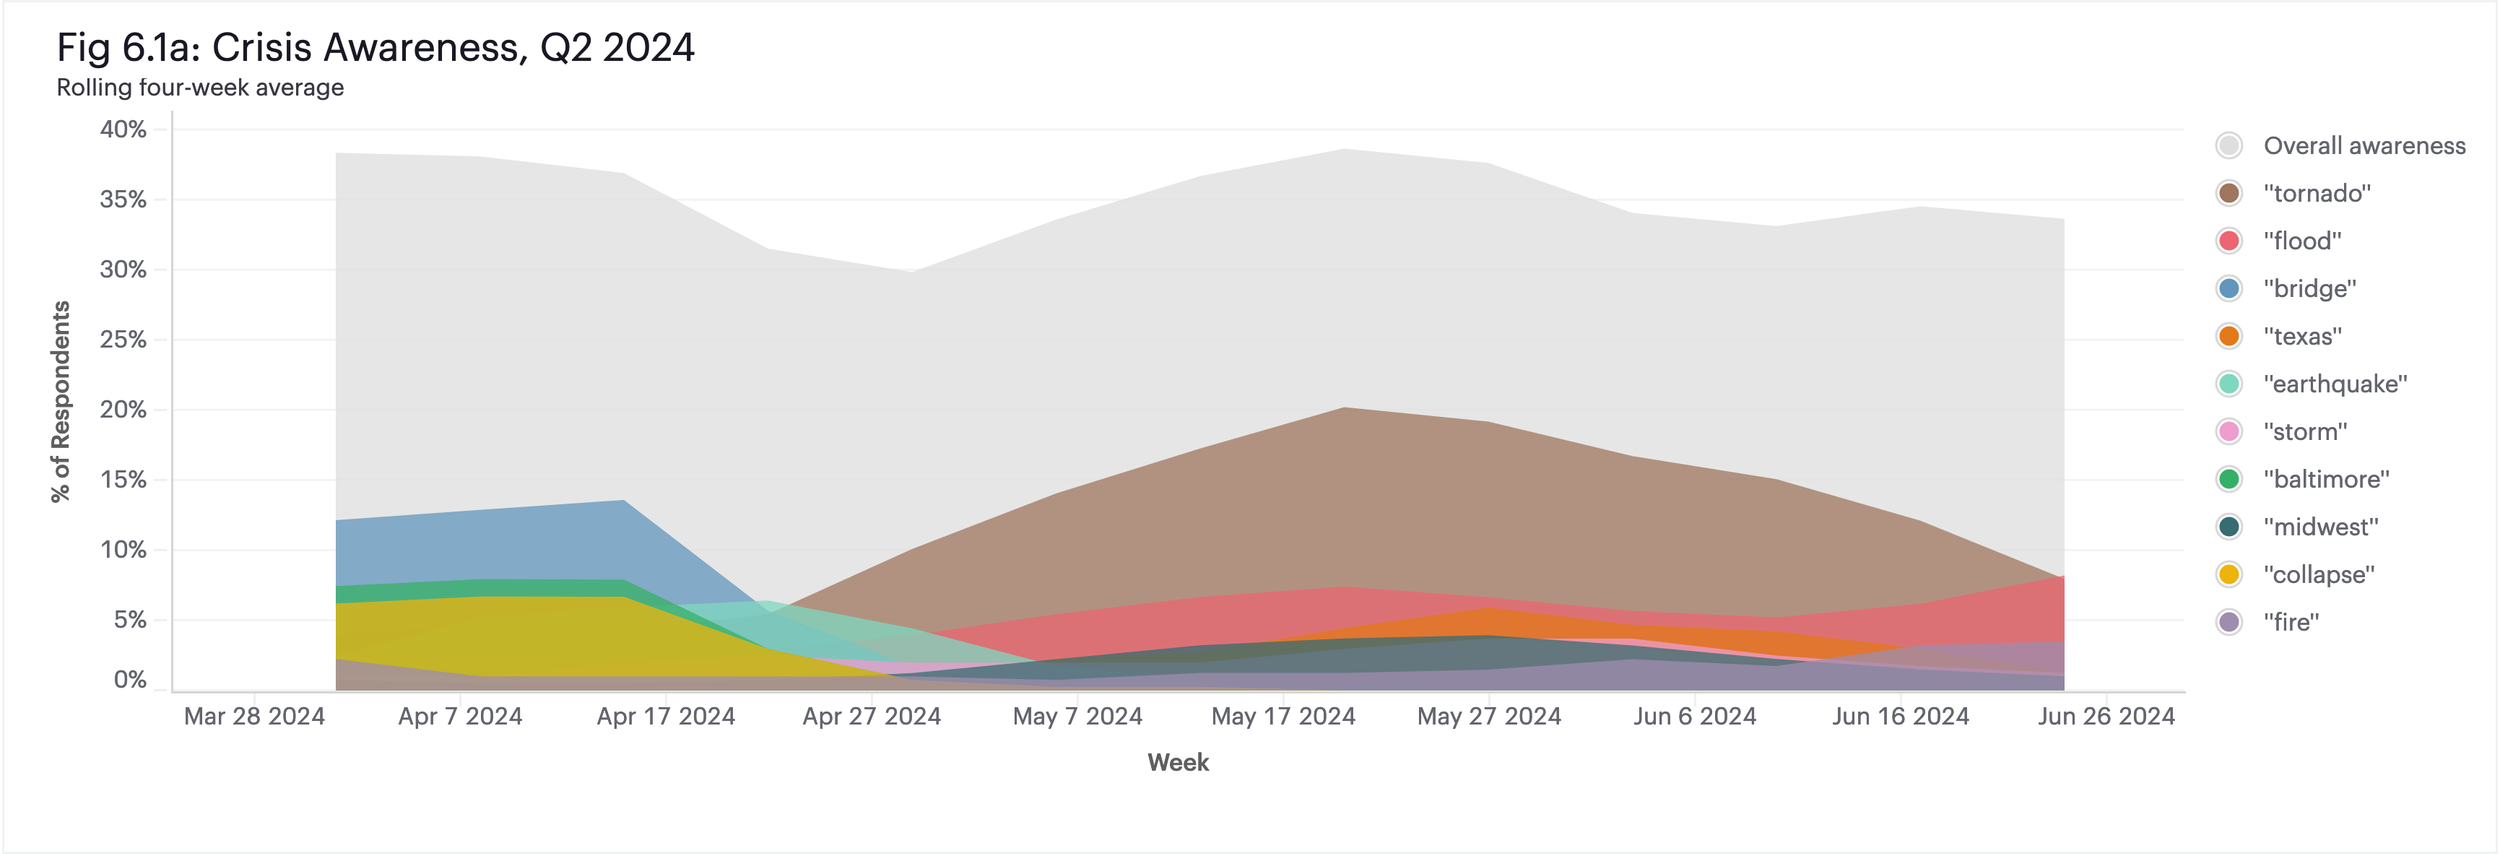
Crisis awareness was generally lower this quarter than last quarter, at 35% of respondents aware overall compared with 40% in Q1 2024. The top crises of note were the collapse of the Francis Scott Key Bridge in Baltimore, Maryland on March 26; the 7.4 magnitude earthquake in Hualien City, Taiwan on April 3; severe flooding in the midwest and northeast US, Texas, Florida, and Rio Grande do Sul, Brazil; wildfires in California and New Mexico; and a multitude of severe weather events in Texas, including tornadoes, severe storms, and resulting flooding. Disaster awareness this quarter skewed towards US-based events, in contrast to the past two quarters where international crises like the Israel-Hamas war and the Noto Peninsula earthquake in Japan were predominant.
The top crises identified by respondents this quarter were tornados across the US, with 2024 representing the most active tornado season since 2017. The US tornado season shows up strongly in the GivingPulse crisis awareness data, with “tornado” being by far the most commonly reported crisis word in both Q2 2023 and Q2 2024. It is interesting to note that despite the severity of this year’s season, awareness levels at their peak were approximately the same as last year at around 20% of respondents reporting awareness of a tornado-related disaster each year. Awareness this year, however, does appear to have been more sustained than last year indicating a higher level of awareness overall.

While crisis awareness was down, there were some interesting trends observed in crisis response this quarter. The largest shift was a 17% drop in individuals who had not yet responded but did intend to in the future, which contributed to an increase in both generous response and ignoring crises altogether. Generous response was at a notably low rate in Q1 2024 and recovered up to 25% of crisis aware respondents reporting that they had already responded with generosity in Q2. 40% of GivingPulse respondents ignored crises, making ignorance the most popular (although not the majority) reaction to crisis this quarter.
There was a noticeable shift in the geographic distribution of generosity amongst those who responded to crisis in Q2 compared with Q1, corresponding to the proximity of crises that were top of mind this quarter. Giving within the US but beyond one’s local community increased by nearly half up to 39% of crisis responders giving to non-local causes. A corresponding shift away from giving internationally occurred — only 6% of those responding to a recent crisis gave internationally this quarter, compared with 17% last quarter. Local giving remained unchanged. As observed in Section 1, there was a shift away from international giving overall this quarter and this appears to be due at least in part to the nature of the crisis that people were aware of.

These results demonstrate that Americans are ready to mobilize in response to crises at a national scale, but that the nature of crises and corresponding relief efforts occurring this quarter generated a more decisive response from the public. For more seasonal events that garner widespread attention – tornados, hurricanes, wildfire season – organizations may consider preparing their appeals for support in advance and approach resourcing at a regional or national in scope. People appear to be ready to be generous at a more regional level in the face of crisis without detracting from local generosity. Localizing your outreach and messaging is important, but could potentially be done for the benefit of other communities in extenuating circumstances such as natural disaster.
It will be interesting to see if these trends in crisis awareness and response continue into Q3, particularly as it relates to the impact of Hurricane Beryl in the southern US.
